color = Temperature not working but why?

library(ggplot2)

#set working directory
setwd("C:/Users/MOHANKRISHNA/Desktop/datascience")

#Loading csv files
data1 <- read.csv("C:/Users/MOHANKRISHNA/Desktop/datascience/bigcity.csv")

#Create simple Box-Plots
ggplot(data=data1, aes(x=u, y=x, color = temperature)) + geom_point(size=3) 
#> Error in FUN(X[[i]], ...): object 'temperature' not found

Dataset : https://vincentarelbundock.github.io/Rdatasets/csv/boot/bigcity.csv

Temperature is the color name.

I don't think "temperature" is a valid colour name. You can check in colours().

If you wish to specify a colour separately, use it outside the aes mapping.

Your code expects temperature to be a column in the data set, whose values are discrete. But the problem is that this dataset doesn't have a column named temperature:

> str(object = read.csv(file = 'bigcity.csv'))
'data.frame':	49 obs. of  3 variables:
 $ X: int  1 2 3 4 5 6 7 8 9 10 ...
 $ u: int  138 93 61 179 48 37 29 23 30 2 ...
 $ x: int  143 104 69 260 75 63 50 48 111 50 ...
library(ggplot2)

#set working directory
setwd("C:/Users/MOHANKRISHNA/Desktop/datascience")

#Loading csv files
data1 <- read.csv("C:/Users/MOHANKRISHNA/Desktop/datascience/bigcity.csv")

#Create simple Box-Plots
ggplot(data=data1, aes(x=u, y=x)) + geom_point(size=3)


ggplot(data=data1, aes(x=u, y=x, color='blue')) + geom_point(size=3)

Created on 2019-06-23 by the reprex package (v0.3.0)

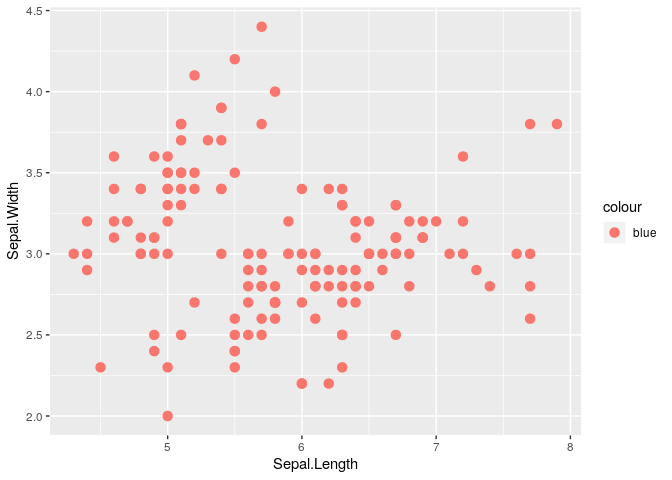
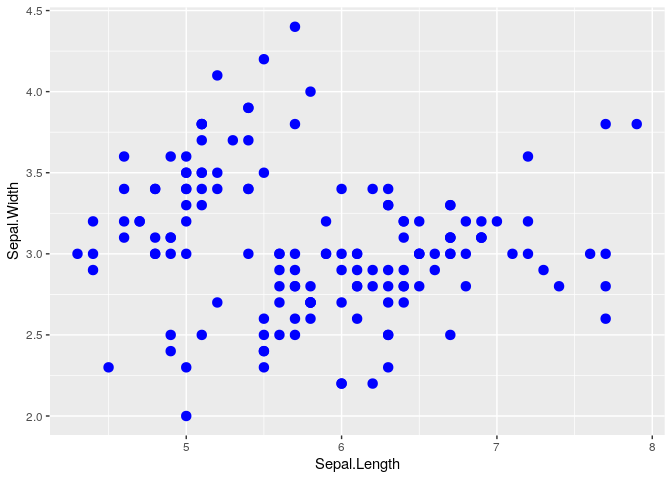
As Yarnabrina said before, if you want to specify a color you have to do it outside the aes() function and inside the desired geom_(), this is because you can't map an aesthetic to a character string (i.e. "blue"), see this example:

library(ggplot2)
ggplot(data=iris, aes(x=Sepal.Length, y=Sepal.Width, color='blue')) + geom_point(size=3)

ggplot(data=iris, aes(x=Sepal.Length, y=Sepal.Width)) + geom_point(size=3, color='blue')

1 Like

This topic was automatically closed 21 days after the last reply. New replies are no longer allowed.