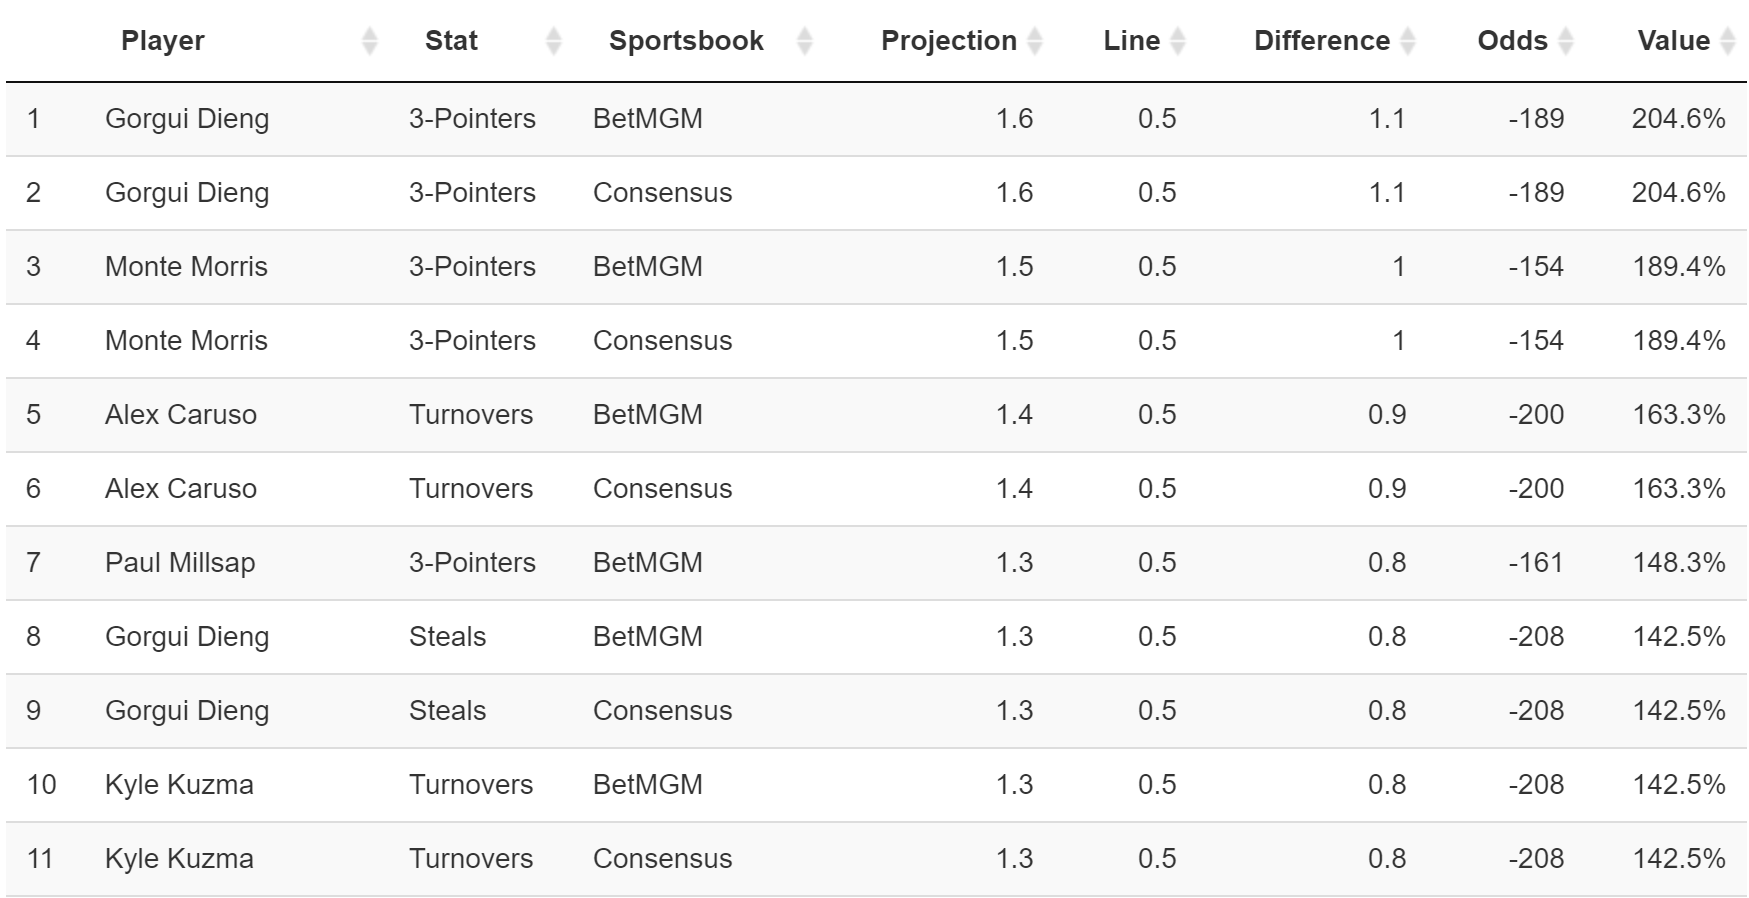
It's pretty simple, but I haven't found a simple solution for this yet. I'm trying to have the "Value" column in this R Shiny Datatable to be conditionally formatted with 0 being white and the highest value being dark green:
The following is the current output section for this datatable:
output$bet_values <- DT::renderDataTable({
    datatable(value_data(),
              options = list(lengthMenu = c(25, 50, 100), pageLength = 25)) %>%
        formatPercentage("Value", 1)
})
Any help is appreciated - let me know if anything else would be helpful to know!