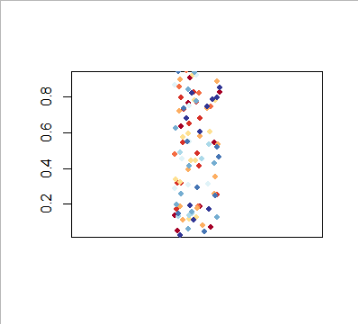
However, I haven't been able to color de dots as I want, that is, plot the values of the 2nd column with colors according to the values of the 1st column.
If possible, I would like to use a red-blue palette like RColorBrewer::brewer.pal(n=10, name="RdYlBu"), but I am not sure how to implement it.
The factor should be associated to discrete values, if you have 100 random numbers generally you have 100 different factors (and thus 100 different colors), then to index the colour you need to use something else (or use cut for example)
You need to change pch to 21 and use bg rather than color. I don't know why but in this way it works.
The second point seems an inconsistency between plot and stripchart. If you do plot(1:10, col = 1:10) you get 10 different colours but with stripcharts I wasn't able to use col in this way but only bg.