Color code coordinates based on location?

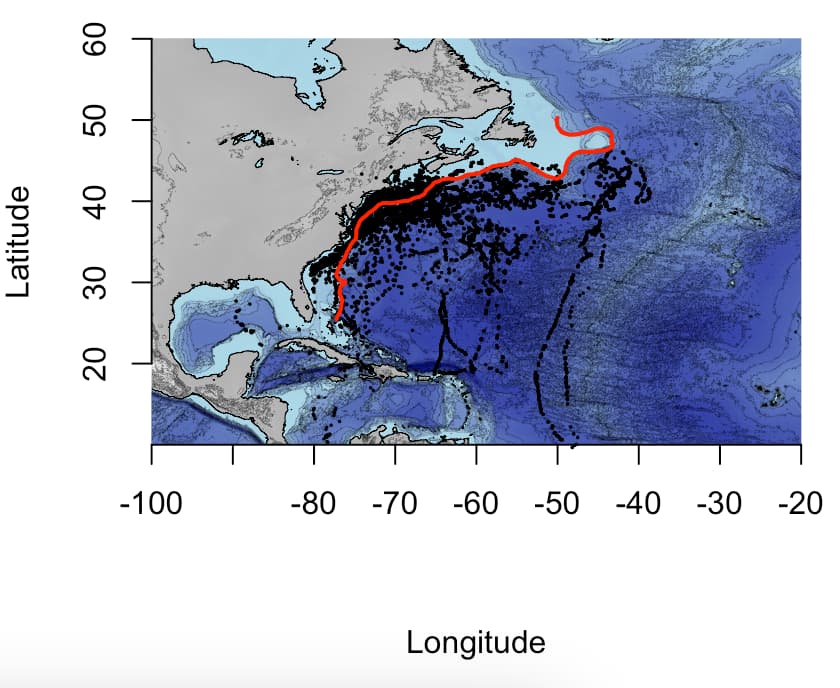
Hi, I would like to 'color code' all the locations I have (latitude and longitude) based on the dividing line on my map. That would mean, that all locations to the left of that line are yellow, and all the locations to the right of that line are green.
I have not been able to find a solution in r of how to do this. Any help? I have attached my code below to make the plot. To describe my data, it is a series of lon and lat coordinates, and the 'line' is the same.

aleu<- getNOAA.bathy(lon1 = -100, lon2 = -20, lat1 = 10, lat2 = 60, resolution = 3, keep = TRUE)
plot(aleu, image = TRUE, land = TRUE, axes = FALSE, lwd=0.1,
     bpal = list(c(0, max(aleu), grey(.7), grey(.9), grey(.95)),
                 c(min(aleu), 0, "darkblue", "lightblue")))
plot(aleu, n = 1, lwd = 0.5, add = TRUE)

# Add latitude and longitude grid lines
axis(1, at = seq(-100, -20, by = 10), labels = TRUE, pos = 10)  # Longitude (bottom)
axis(2, at = seq(20, 60, by = 10), labels = TRUE, pos = -100)  # Latitude (left)
points(subset_dataanim$lon,subset_dataanim$lat,pch = 16, cex = 0.25)

lines(pathway$Longitude, pathway$Latitude, col = "red", lwd = 2)

Someone else may know how to do this with base R graphics, but in ggplot2 the function geom_polygon() could be used to choose colors for regions to the left and right of the line. However, you would 1) need to introduce the lower and upper points of intersection of the regions with the left and right edges of the plots, and 2) likely need to smooth the line to ensure that it represents a non-intersecting path.

1 Like

I'm not familiar with maps, but since you seem to be using standard R plotting you could just fit a smooth function to your curve, for example a spline, and then look at which side you're on. The exact smoothing can have an important effect, especially at positions outside of your main line.

# example with a set of points
pathway <- data.frame(Longitude = c(-75, -70, -50, -40, -50),
                      Latitude = c(35, 40, 45, 50, 55))
subset_dataanim <- data.frame(lon = c(-90, -71, -69, -70, -40, -45, -45),
                              lat = c(30, 40,40, 35, 42, 50, 55))


fitted_pathway <- spline(x = pathway$Latitude,
                         y = pathway$Longitude,
                         xout = subset_dataanim$lat)

subset_dataanim$side <- ifelse(subset_dataanim$lon -fitted_pathway$y > 0,
                               "violet",
                               "darkgreen")

plot(1, xlim = c(-100, -20), ylim = c(20, 60))

lines(pathway$Longitude, pathway$Latitude, col = "red", lwd = 2)

points(subset_dataanim$lon,subset_dataanim$lat,pch = 'x',
       col = subset_dataanim$side)


# look at many random points to find problems
set.seed(1)
subset_dataanim <- data.frame(lon = runif(100, -100, -20),
                              lat = runif(100, 20, 60))
fitted_pathway <- spline(x = pathway$Latitude,
                         y = pathway$Longitude,
                         xout = subset_dataanim$lat)

subset_dataanim$side <- ifelse(subset_dataanim$lon -fitted_pathway$y > 0,
                               "violet",
                               "darkgreen")

plot(1, xlim = c(-100, -20), ylim = c(20, 60))

lines(pathway$Longitude, pathway$Latitude, col = "red", lwd = 2)

points(subset_dataanim$lon,subset_dataanim$lat,pch = 'x',
       col = subset_dataanim$side)

Created on 2023-11-01 with reprex v2.0.2

This topic was automatically closed 42 days after the last reply. New replies are no longer allowed.

If you have a query related to it or one of the replies, start a new topic and refer back with a link.