Hello all,
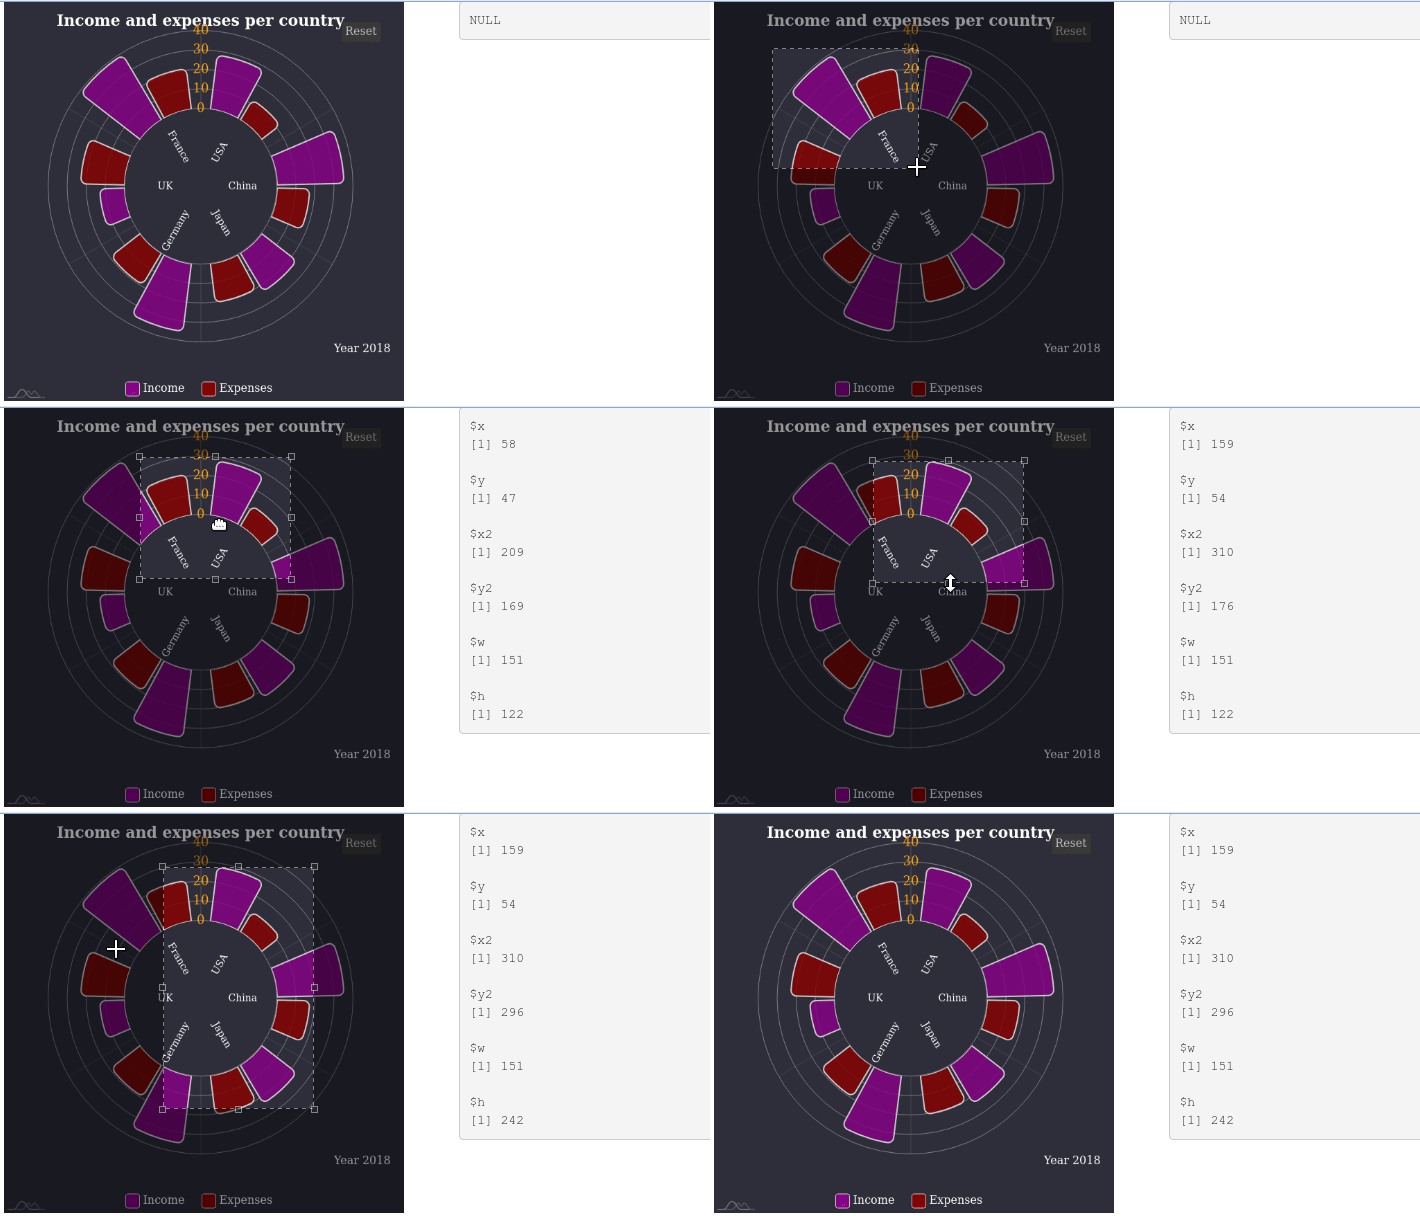
I'm trying to collect the ymin, ymax, xmin and xmax coordinates from an image just like it's possible to do with a plot using the brush function, as described here :
ui <- fluidPage(
  plotOutput("plot", brush = "plot_brush"),
  tableOutput("data")
)
server <- function(input, output, session) {
  output$plot <- renderPlot({
    ggplot(mtcars, aes(wt, mpg)) + geom_point()
  }, res = 96)

  output$data <- renderTable({
    brushedPoints(mtcars, input$plot_brush)
  })
}
noveld
August 10, 2020, 1:06pm
2
1 Like
You want to select an area of the image? And then, what do you want to do with the coordinates?
Hi @saturne ,
Here is a way using the Jcrop JavaScript library.
library(shiny)

js <- HTML(c(
  "$(document).ready(function(){",
  "  $('#myimg').Jcrop({",
  "    onSelect: function(coords){",
  "      Shiny.setInputValue('crop', coords);",
  "    }",
  "  });",
  "});"
))


ui <- fluidPage(

  tags$head(
    tags$link(rel = "stylesheet", href = "https://cdnjs.cloudflare.com/ajax/libs/jquery-jcrop/0.9.15/css/jquery.Jcrop.min.css"),
    tags$script(src = "https://cdnjs.cloudflare.com/ajax/libs/jquery-jcrop/0.9.15/js/jquery.Jcrop.min.js"),
    tags$script(js)
  ),

  fluidRow(
    column(
      width = 6,
      tags$img(id = "myimg", src = "RadialBarChart.png", width = 400, height = 400)
    ),
    column(
      width = 6,
      verbatimTextOutput("coordinates")
    )
  )

)

server <- function(input, output){
  output[["coordinates"]] <- renderPrint(input[["crop"]])
}

shinyApp(ui, server)
1 Like
Yep, this is brilliant, thank you so much!
system
August 28, 2020, 8:48pm
7
This topic was automatically closed 7 days after the last reply. New replies are no longer allowed.
