Hello! This is my first post. I have a question about coefplot. I was doing something for fun, for a fantasy league I'm doing with some friends, and I noticed an odd behavior in coefplot, which concerns me also (especially!) for more serious applications.
I showing all my code below:
# Create data
df <- data.frame(team = c("team_1", "team_2", "team_3", "team_4",
"team_5", "team_6", "team_7", "team_8"),
goals_scored = c(29, 26, 23, 20, 24, 24, 20, 16),
goals_conceded = c(17, 18, 16, 23, 22, 27, 26, 33),
points = c(18, 17, 17, 11, 10, 10, 7, 7)
)
print(df)
# Estimate model
mymodel <- lm(points ~ goals_scored + goals_conceded, data = df)
# Model summary
summary(mymodel)
# Coefficients:
# Estimate Std. Error t value Pr(>|t|)
# (Intercept) 20.3709 12.1361 1.679 0.1541
# goals_scored 0.2242 0.3324 0.675 0.5299
# goals_conceded -0.5867 0.2308 -2.542 0.0517 .
# ---
# Signif. codes: 0 ‘***’ 0.001 ‘**’ 0.01 ‘*’ 0.05 ‘.’ 0.1 ‘ ’ 1
# Compute confidence intervals
confint(mymodel)
# 2.5 % 97.5 %
# goals_conceded -1.1798760 0.006525498
# Import ggplot2 and coefplot libraries
library(ggplot2)
library(coefplot)
# Create coefplot
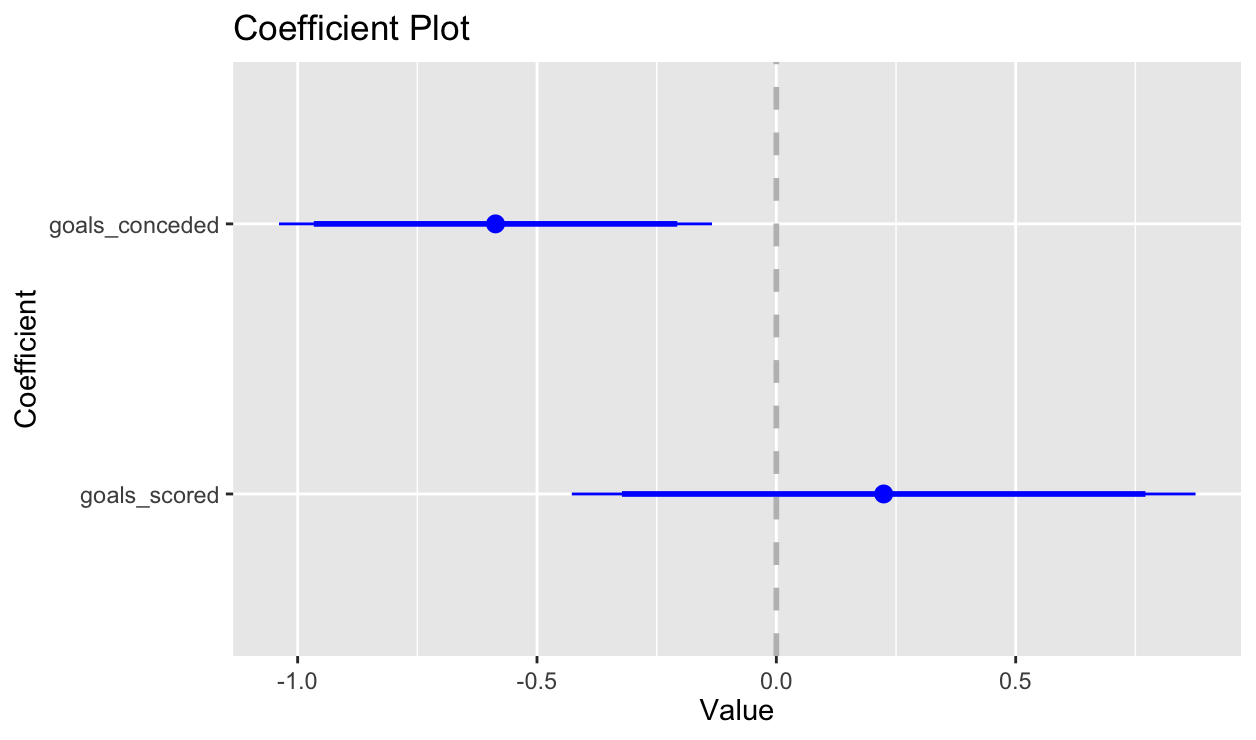
coefplot(mymodel,
intercept = FALSE, # hide intercept
innerCI = 1.645, # SD = 1.645 for inner CI = 90% sig
outerCI = 1.96) # SD = 1.96 for outer CI = 95% sig
# Default coefplot: inner CI = 1 SD; outer CI = 2 SD
coefplot(mymodel,
intercept = FALSE) # hide intercept
Basically, I'm predicting points using goals scored and conceded. As you see, goals_conceded is marginally significant (p=0.0517). Thus, I would expect its confidence interval to overlap with 0 both in the first plot and in the second (default) one. But that's not the case!? I'm attaching one plot as an example.
Am I missing something?
Thanks!