Hey guys!
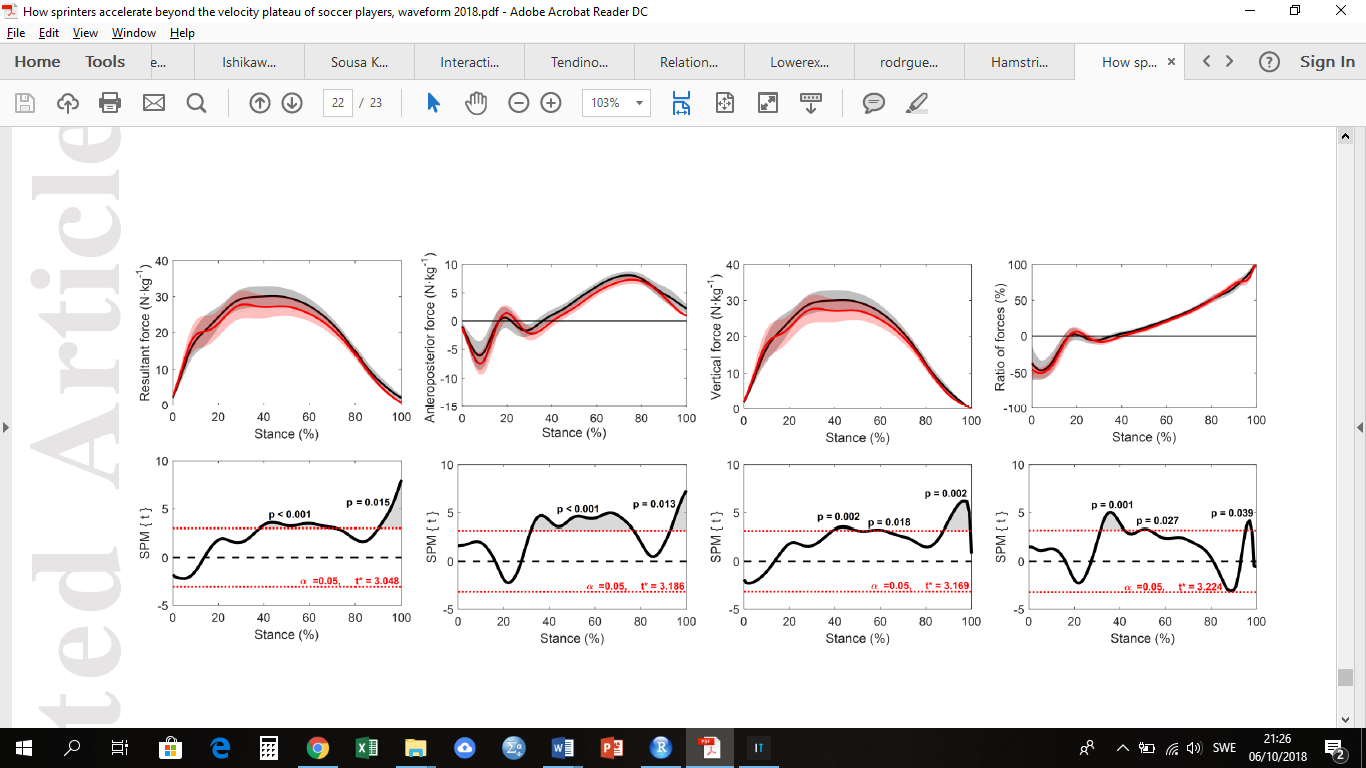
I would love to have help creating statistical paramteric mapping (SPM) in R studio for the biomechanics studies im doing, see screenshot i attached.
SPM{t} refers to the t statistic (calculated from mean, SD and sample size similar to a t-test) values for each time point in the time-normalized data. The thresholds are calculated so that only 5% of random smooth curves traverse, i.e. for p = 0.05. If the value is higher than the threshold than there is a statistical difference between those points of the curves. These statistically different regions are called supra-threshold clusters. P values are calculated for each cluster. I have attached a very clear description of this method that is called Statistical Parametric Mapping
Can anyone help? Does the code already exist?