Greetings,
I just got thrown a project to complete with R and I am VERY new (I only knew some basic Command Line and Python before this), so I hope my question is a simple one. I've been googling and self teaching for the last week or so, but haven't found an example for what I'm trying to accomplish.
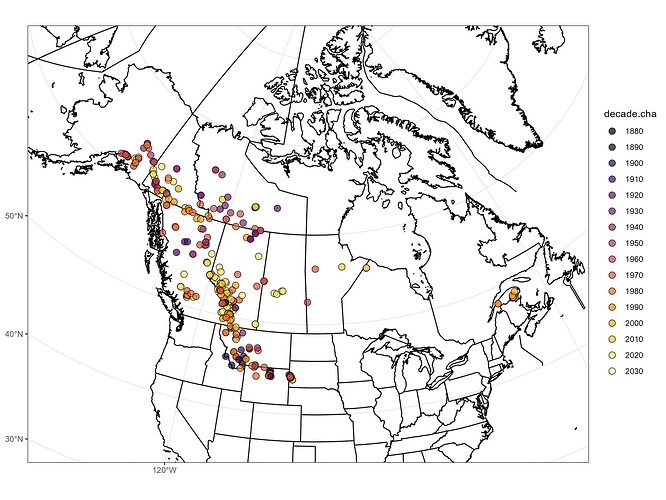
I'm plotting locations of different plant species according to decade and sample source. I have the decade part down and color-coded, but I have a column in my dataset called 'basisOfRecord' with two categories in it. 'HumanObservation' or 'PreservedSpecimen.'
Basically I'd just like triangles for the preserved plants and the circles I have now for the observed ones. How would I change my code to include that? Here's my script and a picture of what it produces for me.
Please let me know if I need to change my post formatting or provide any more information or attach my dataset or something. I'm sorry if my code is really messy!
library(tidyverse)
library(lubridate)
library(viridis)
library(sf)

americanus <- read.csv("C:/Users/MayeJ/Documents/Map Data/GBIF/Americanus/americanus.csv")

month <- 1
day <- 1
americanus$TrueDate <- as.Date(paste(americanus$TrueDate, month, day, sep = "-"))
print(americanus$TrueDate)

americanus <- americanus[complete.cases(americanus$decimalLatitude, americanus$decimalLongitude), ]

obs.year = lubridate::year(americanus$TrueDate)
decade.cha = as.character(floor(obs.year / 10) * 10)
decade = (floor(obs.year / 10) * 10)
americanus <- st_as_sf(americanus, coords = c("decimalLongitude", "decimalLatitude"), crs = 4326)

crs = "WGS84"
agr = "constant"
remove = F

class(americanus)

north.america.bound <- st_read("/Users/MayeJ/Documents/Map Data/NA_PoliticalDivisions/NA_PoliticalDivisions/data/bound_l/boundary_l_v2.shp")

americanus.map <- ggplot(data = north.america.bound) +

  theme_bw() +
  geom_sf(fill = "gray90", color = "black") +
  geom_sf(data = americanus, # plots the data points
          size = 3,
          shape = 21,
          alpha = 0.7,
          aes(fill = decade.cha)) +
  scale_fill_viridis(option = "B", discrete = T, direction = 1) +

  coord_sf(xlim = c(-3235000, 3062000),
           ylim = c(-900000, 4007000))

americanus.map

ggsave(plot = americanus.map,
       "C:/Users/MayeJ/Documents/Map Data/GBIF/Americanus/americanusmap.jpg",
       device = "jpg", dpi = 300, units = "in",
       width = 10, height = 7.5)
