Firstly, thank you all for the space fo post questions regarding R. I just started using R regularly at work, and thus, questions are now coming!
My main question here is: is it possible to cluster based off on 1 single column?
I have customer purchase amounts, and would like to cluster them either with Kmeans, or with any other function available.
The examples I have found always have 2 or more columns, which are used to cluster the data together. Is this possible?
The column really only has the name "Purchase Amount", and all the purchase amounts in that column. I am looking for the best way to group them together, but can't seem to figure out how to do it.
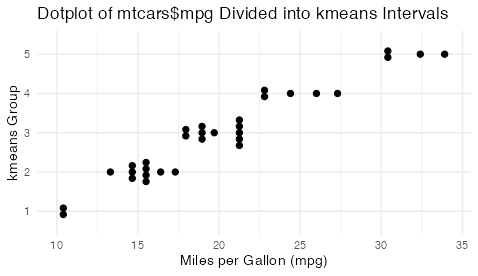
To plot a vector, v, in a way that shows some classification of the values of v into different categories. The classification derived from some algorithm must be identified to the plot method either explicitly as a separate variable (such as a vector of kmeans clusters) or implicitly provided by algorithm. For example, there's the binning performed by hist().
Here's an example of using kmeans clustering of a single continuous variable to create a plot of the mtcars$mpg variable according to membership in a kmeans cluster. Other interval algorithms can also be specified.
# Load required packages
library(classInt)
library(ggplot2)

# Load the mtcars dataset
data(mtcars)

# Calculate kmeans intervals
num_intervals <- 5
kmeans_intervals <- classIntervals(mtcars$mpg, num_intervals, style = "kmeans")

# Assign each mpg value to its corresponding interval
mtcars$kmeans_group <- cut(mtcars$mpg, breaks = kmeans_intervals$brks, include.lowest = TRUE, labels = FALSE)

# Create the dotplot using ggplot2
ggplot(mtcars, aes(x = factor(kmeans_group), y = mpg)) +
  geom_dotplot(binaxis = "y", stackdir = "center", dotsize = 0.5) +
  labs(title = "Dotplot of mtcars$mpg Divided into kmeans Intervals",
       x = "kmeans Group",
       y = "Miles per Gallon (mpg)") +
  coord_flip() +
  theme_minimal()
#> Bin width defaults to 1/30 of the range of the data. Pick better value with
#> `binwidth`.