There are sevreal links in my shiny app web.
It always reload or the interface blurring when I go back the web after clicking a hyperlink.
Just like this:
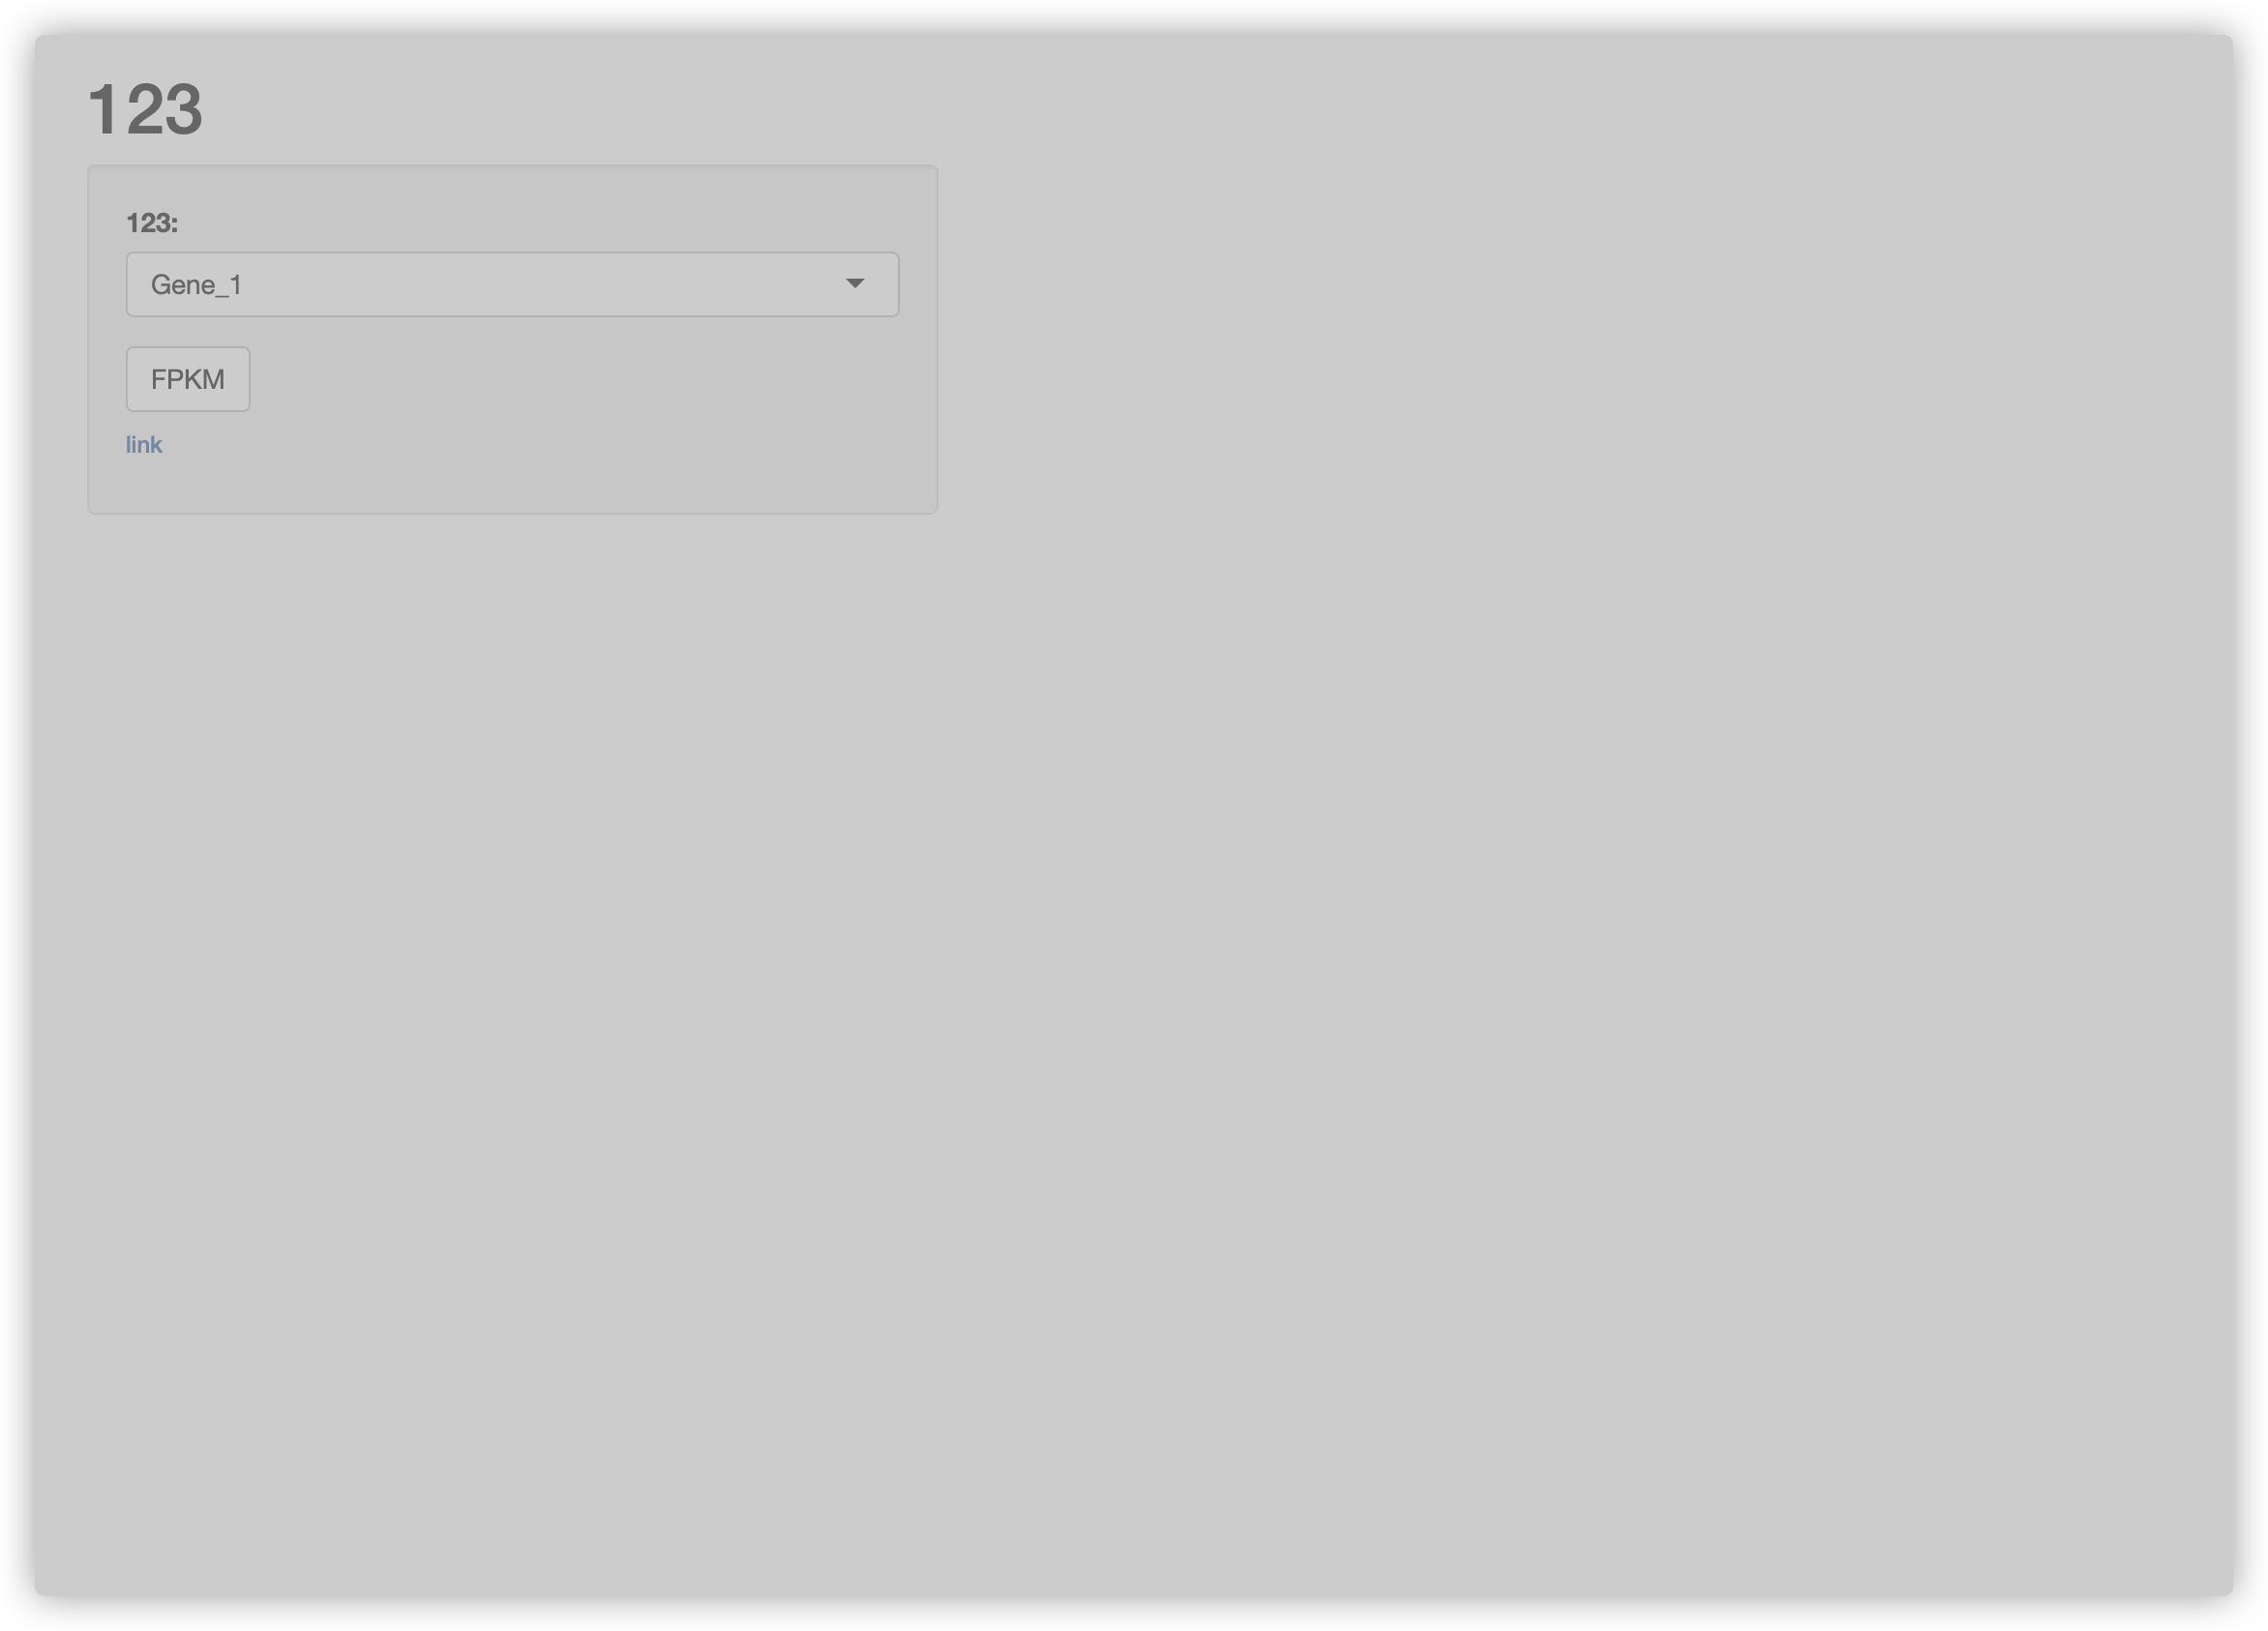
I know it's necessary for me to solve it.But I don't know where the wrong with my code or it is some problem with shiny app server ??
Here is my sample code:
library(shiny)
library(dplyr)
library(tidyr)
library(ggplot2)
library(gridExtra)

mean_data <- data.frame(
  Name = c(paste0("Group_", LETTERS[1:20])),
  matx <- matrix(sample(1:1000, 1000, replace = T), nrow = 20)
)
names(mean_data)[-1] <- c(paste0("Gene_", 1:50))

sd_data <- data.frame(
  Name = c(paste0("Group_", LETTERS[1:20])),
  matx <- matrix(runif(1000, 5, 10), nrow = 20)
)
names(sd_data)[-1] <- c(paste0("Gene_", 1:50))


###
ui <- fluidPage(

  pageWithSidebar(
    headerPanel("123"),
    sidebarPanel(
      selectInput(
        "selectGeneSymbol",
        "123:",
        choices = colnames(mean_data)[-1],
        multiple =F,
        width = 400,
        selected = 1
      ),

      actionButton(inputId = "plot1", label = "FPKM"),
      tags$h6(tags$a(href="https://www.ncbi.nlm.nih.gov/", "link"))
    ),
    mainPanel(
      plotOutput("plot")
      #uiOutput("all")
    )
  )

)

server <- function(input, output, session) {

  ## put sd into mean_data
  plotdata <- eventReactive(input$plot1, {
    df <- mean_data %>% mutate(sd = sd_data[,input$selectGeneSymbol])
  })

  p1 <- eventReactive(input$plot1, {
    ggplot(data = plotdata(), aes(x = Name, y = .data[[input$selectGeneSymbol]], fill=Name,
                                  ymin = .data[[input$selectGeneSymbol]] - sd, ymax = .data[[input$selectGeneSymbol]] + sd )) +
      geom_bar(stat = "identity", position = position_dodge(0.9), width = 0.9) +
      # geom_errorbar(aes(ymin = plotdata()[,input$selectGeneSymbol] - sddata()[,input$selectGeneSymbol], ymax = plotdata()[,input$selectGeneSymbol] + sddata()[,input$selectGeneSymbol]), width = .2, position = position_dodge(0.9)) +
      geom_errorbar(width = .2, position = position_dodge(0.9)) +
      theme_classic2() +
      rotate_x_text(angle = 45) +
      theme(legend.position = "none") +
      labs(title = input$selectGeneSymbol, x = NULL, y = "123_value")
  })

  output$plot <- renderPlot({
    p1()
  })

}

# Create Shiny app ----
shinyApp(ui = ui, server = server)
Can you give me some advice ro solution ?? It's vital for me to deal with it.