I would like to creat a chart in plot. I have a file in csv. Date and cons
umption. Please advise me
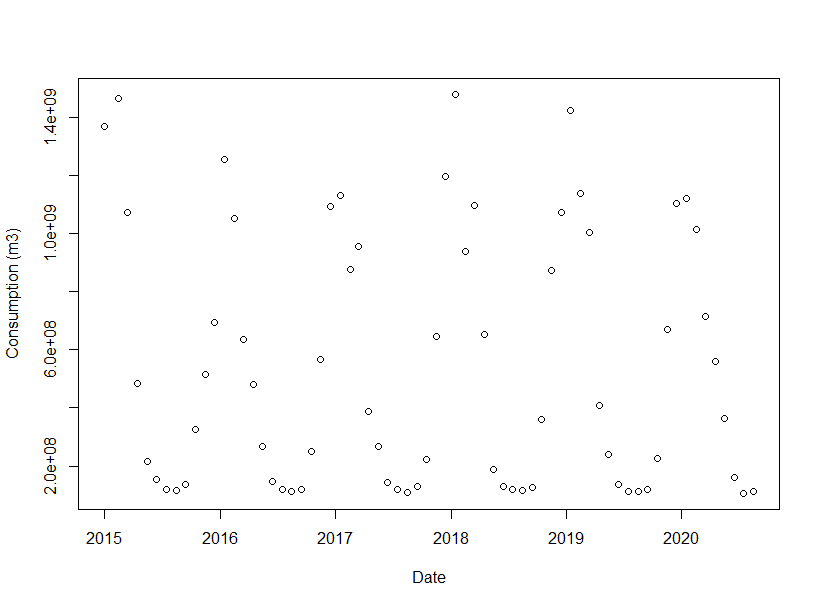
And I like connect the point in chart and after that some ARIMA forecast
What did you try? Have a look at ggplot and 'fable'
Also , post a reproducible example of your data instead of a screenshot of it.
there is too much information for a short time. I m looking old code. I have some problems with it. I
system
Closed
5
This topic was automatically closed 21 days after the last reply. New replies are no longer allowed.
If you have a query related to it or one of the replies, start a new topic and refer back with a link.