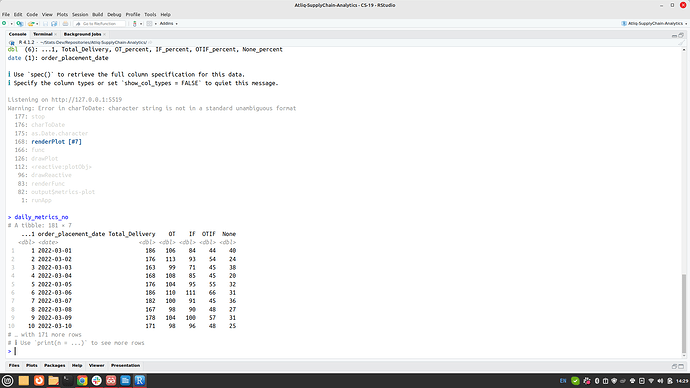
character string is not in a standard unambiguous format error in Shiny ggplot

I have the app. R as following

# load libraries ----

library(shiny)
library(tidyverse)
library(here)


# load data sets ----
daily_metrics_no <- vroom::vroom(here("Data-Files/processed/daily_metrics_no.csv"))
daily_metrics_cent <- vroom::vroom(here("Data-Files/processed/daily_metrics_cent.csv"))


choices <- c("Total_Delivery", "OT", "IF", "OTIF", "None")

ui <- fluidPage(
  titlePanel(title = "Supply Chain Analytics Web App"),
  tabsetPanel(
    tabPanel(
      "Introduction",
      sidebarLayout( # layouts the app inside bar and main
        sidebarPanel(
          h2("Introduction"),
          p("The purpose of the application is to track and analyze 
          the Supply Chain Metrics. The application provides a detailed overview
          of Supply Metrics by Products, Customers and City. A sperate tab is 
            made for each category of Analysis."),
          br(),
          # insert company image
          img(src = "StatDevs.png", height = 150, width = 150),
          br(),
          "The application is developed by ", 
          span("Stat Devs", style = "color:blue")
          ),
        mainPanel(
          h1("Metrics List"),
          tableOutput(outputId = "metricstable")
          )
        )
      ),
    
    tabPanel("Performance Over Time",
             sidebarLayout(
               sidebarPanel(
                 selectInput("metrics", "Metrics", choices = choices,
                             selected = 1)
                 ),
               mainPanel(
                 plot_UI(id  = "metrics")
                 
                 )
               )
             ),
    tabPanel("Products Metrics"),
    tabPanel("Customer Metrics"),
    tabPanel("City Metrics")
  )
)

server <- function(input, output, session) {
  
  # Convert order_placement_date to date format
   daily_metrics_no$order_placement_date <- lubridate::ymd(daily_metrics_no$order_placement_date)
  
  # metrics table in Introduction
  output$metricstable <- renderTable(metrics)
  
  # Graph in Performance Over Time ----
  
  # collect metric by user
  selected_metrics <- reactive({
    daily_metrics_no[, input$metrics]
      })
   
  observe({
    plot_Server(id = "metrics", data = selected_metrics(), date_var = "order_placement_date", y_var = input$metrics)
  })
  
}

shinyApp(ui, server)

I have the plot module as

plot_UI <- function(id) {
  ns <- NS(id)
  tagList(
    fluidRow(
      column(11, plotOutput(NS(id, "plot"))),
    )
  )
}


plot_Server <- function(id, data, date_var, y_var) {
  moduleServer(
    id,
    function(input, output, session) {
      output$plot <- renderPlot({
        ggplot(data = data, aes(x = as.Date({{ date_var }}), y = {{ y_var }} %>% pull())) +
          geom_line() +
          labs(x = "Order Placement Date", y = input$metrics)
      })
      return(output$plot)
    }
  )
}


plot_demo <- function() {
  
  date <- sample(seq(as.Date('1999/01/01'), as.Date('2000/01/01'), by = "day"), 12)
  df <- data.frame(date = date, y_var = 1:12)
  ui <- fluidPage(
    plot_UI(id = "x")
    )
  server <- function(input, output, session) {
    plot_Server(id = "x", data =  df, date_var = "date", y_var = "y_var")
  }
  shinyApp(ui = ui, server = server)
  
}

When I type

str(daily_metrics_no$order_placement_date)

it returns:

Date[1:181], format: "2022-03-01" "2022-03-02" "2022-03-03" "2022-03-04" "2022-03-05"

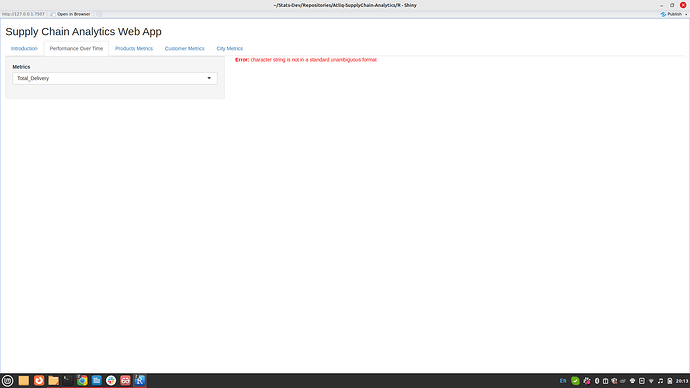
But when I run the shiny application I get the following error in place of the plot.

character string is not in a standard unambiguous format

Can anyone help me why I am getting this error?
you didnt provide a reprex (no data) so I made a minimal one (incomplete) then I made adjustments to your code till I got it working enough to show initial plot


library(shiny)
library(tidyverse)

plot_UI <- function(id) {
  ns <- NS(id)
  tagList(
    fluidRow(
      column(11, plotOutput(NS(id, "plot"))),
    )
  )
}


plot_Server <- function(id, data, date_var, y_var) {
  moduleServer(
    id,
    function(input, output, session) {
      output$plot <- renderPlot({
        ggplot(data = data, aes(x =!!sym(date_var), 
                                y = !!sym(y_var))) +
          geom_line() +
          labs(x = "Order Placement Date", y = input$metrics)
      })
    }
  )
}

# load data sets ----
daily_metrics_no <- data.frame(order_placement_date=c("2022-03-01",
                         "2022-03-02",
                         "2022-03-03",
                         "2022-03-04",
                         "2022-03-05"),
                         Total_Delivery=1:5)

daily_metrics_no$order_placement_date <- lubridate::ymd(daily_metrics_no$order_placement_date)

choices <- c("Total_Delivery", "OT", "IF", "OTIF", "None")

ui <- fluidPage(
  titlePanel(title = "Supply Chain Analytics Web App"),
  tabsetPanel(
    tabPanel(
      "Introduction",
      sidebarLayout( # layouts the app inside bar and main
        sidebarPanel(
          h2("Introduction"),
          p("The purpose of the application is to track and analyze 
          the Supply Chain Metrics. The application provides a detailed overview
          of Supply Metrics by Products, Customers and City. A sperate tab is 
            made for each category of Analysis."),
          br(),
          # insert company image
          img(src = "StatDevs.png", height = 150, width = 150),
          br(),
          "The application is developed by ", 
          span("Stat Devs", style = "color:blue")
        ),
        mainPanel(
          h1("Metrics List"),
          tableOutput(outputId = "metricstable")
        )
      )
    ),
    
    tabPanel("Performance Over Time",
             sidebarLayout(
               sidebarPanel(
                 selectInput("metrics", "Metrics", choices = choices,
                             selected = 1)
               ),
               mainPanel(
                 plot_UI(id  = "metrics")
                 
               )
             )
    ),
    tabPanel("Products Metrics"),
    tabPanel("Customer Metrics"),
    tabPanel("City Metrics")
  )
)


server <- function(input, output, session) {
  
  # Convert order_placement_date to date format

  # metrics table in Introduction
  # output$metricstable <- renderTable(metrics)
  
  # Graph in Performance Over Time ----
  
  # collect metric by user
  selected_metrics <- reactive({
    daily_metrics_no |> select(all_of(c("order_placement_date" ,
    input$metrics)))
  })
  
  observe({
    plot_Server(id = "metrics", 
                data = selected_metrics(), 
                date_var = "order_placement_date",
                y_var = input$metrics)
  })
  
}

shinyApp(ui, server)

I am sorry for not providing the reprex. I am very new to Shiny development and have been stuck on the problem for the past week.

Please find the attached code of the plot module. I have made the mentioned changes by you but I am still getting the error: character string is not in a standard unambiguous format

plot_UI <- function(id) {
  ns <- NS(id)
  tagList(
    fluidRow(
      column(11, plotOutput(NS(id, "plot"))),
    )
  )
}


plot_Server <- function(id, data, date_var, y_var) {
  moduleServer(
    id,
    function(input, output, session) {
      output$plot <- renderPlot({
        ggplot(data = data, aes(x = !!sym(date_var), 
                                y = !!sym(y_var))) +
          geom_line() +
          labs(x = "Order Placement Date", y = input$metrics)
      })
    }
  )
}


plot_demo <- function() {
  
  order_placement_date <- c("2022-03-01", 
                            "2022-03-02", 
                            "2022-03-03",
                            "2022-03-04", 
                            "2022-03-05")
  daily_metrics_no <- data.frame(order_placement_date, Total_Delivery = 1:5, OT = 1:5)
  daily_metrics_no$order_placement_date <- lubridate::ymd(df$order_placement_date)
  daily_metrics_no$Total_Delivery <- as.numeric(df$Total_Delivery)
  daily_metrics_no$OT <- as.numeric(df$OT)
  
  ui <- fluidPage(
    plot_UI(id = "x")
    )
  server <- function(input, output, session) {
    plot_Server(id = "x", data =  daily_metrics_no, date_var = "order_placement_date", y_var = "Total_Delivery")
  }
  shinyApp(ui = ui, server = server)
  
}

The app.R looks like this :

# load libraries ----

library(shiny)
library(tidyverse)
library(here)


# load data sets ----

daily_metrics_no <- vroom::vroom(here("Data-Files/processed/daily_metrics_no.csv"))
daily_metrics_cent <- vroom::vroom(here("Data-Files/processed/daily_metrics_cent.csv"))

# data processing ----

# convert the date column to the ymd format
daily_metrics_no$order_placement_date <- lubridate::ymd(daily_metrics_no$order_placement_date)

# collect the metrics 
daily_metrics_no <- daily_metrics_no |> select(order_placement_date ,Total_Delivery, OT, IF, OTIF, None)  

# define the choices of selection
choices <- c("Total_Delivery", "OT", "IF", "OTIF", "None")


# ui ----

ui <- fluidPage(
  titlePanel(title = "Supply Chain Analytics Web App"),
  tabsetPanel(
    tabPanel(
      "Introduction",
      sidebarLayout( # layouts the app inside bar and main
        sidebarPanel(
          h2("Introduction"),
          p("The purpose of the application is to track and analyze 
          the Supply Chain Metrics. The application provides a detailed overview
          of Supply Metrics by Products, Customers and City. A sperate tab is 
            made for each category of Analysis."),
          br(),
          # insert company image
          img(src = "StatDevs.png", height = 150, width = 150),
          br(),
          "The application is developed by ", 
          span("Stat Devs", style = "color:blue")
          ),
        mainPanel(
          h1("Metrics List"),
          tableOutput(outputId = "metricstable")
          )
        )
      ),
    
    tabPanel("Performance Over Time",
             sidebarLayout(
               sidebarPanel(
                 selectInput("metrics", "Metrics", choices = choices,
                             selected = 1)
                 ),
               mainPanel(
                 plot_UI(id  = "metrics")
                 
                 )
               )
             ),
    tabPanel("Products Metrics"),
    tabPanel("Customer Metrics"),
    tabPanel("City Metrics")
  )
)

# server -----

server <- function(input, output, session) {
  
  # Graph in Performance Over Time ----
  
  # collect metric by user
   selected_metrics <- reactive({
     daily_metrics_no |> select(all_of(c("order_placement_date" ,
                                         input$metrics)))
   })
  
  observe({
    plot_Server(id = "metrics", 
                data = selected_metrics(), 
                date_var = "order_placement_date", 
                y_var = input$metrics)
  })
  
}

shinyApp(ui, server)

It is giving the error: character string is not in a standard unambiguous format after I made changes in the app code.

we simply can not proceed to diagnose your problem when we are blind to your data.
does vroom give you daily_metrics_no with a date field in a a Date type ?
if so I would expect your code to work; if not you need to make further changes. I cant see your data , and I dont like to guess, i prefer to know

@nirgrahamuk I have provided a small reprex of data set in the plot demo function. You don't have to guess since the data is generated and I have also provided you with screen shot of the data frame.

Let me know if there is any other thing needed from my end.

this works ...


library(shiny)
library(tidyverse)
plot_UI <- function(id) {
  ns <- NS(id)
  tagList(
    fluidRow(
      column(11, plotOutput(NS(id, "plot"))),
    )
  )
}


plot_Server <- function(id, data, date_var, y_var) {
  moduleServer(
    id,
    function(input, output, session) {
      output$plot <- renderPlot({
        ggplot(data = data(), aes(x = !!sym(date_var), 
                                y = !!sym(y_var()))) +
          geom_line() +
          labs(x = "Order Placement Date", y =y_var())
      })
    }
  )
}

# load data sets ----

daily_metrics_no <- data.frame(order_placement_date=lubridate::ymd(c("2022-03-01",
                                                      "2022-03-02",
                                                      "2022-03-03",
                                                      "2022-03-04",
                                                      "2022-03-05")),
                               Total_Delivery=1:5)

# data processing ----


# define the choices of selection
choices <- c("Total_Delivery", "OT", "IF", "OTIF", "None")


# ui ----

ui <- fluidPage(
  titlePanel(title = "Supply Chain Analytics Web App"),
  tabsetPanel(
    tabPanel(
      "Introduction",
      sidebarLayout( # layouts the app inside bar and main
        sidebarPanel(
          h2("Introduction"),
          p("The purpose of the application is to track and analyze 
          the Supply Chain Metrics. The application provides a detailed overview
          of Supply Metrics by Products, Customers and City. A sperate tab is 
            made for each category of Analysis."),
          br(),
          # insert company image
          img(src = "StatDevs.png", height = 150, width = 150),
          br(),
          "The application is developed by ", 
          span("Stat Devs", style = "color:blue")
        ),
        mainPanel(
          h1("Metrics List"),
          tableOutput(outputId = "metricstable")
        )
      )
    ),
    
    tabPanel("Performance Over Time",
             sidebarLayout(
               sidebarPanel(
                 selectInput("metrics", "Metrics", choices = choices,
                             selected = 1)
               ),
               mainPanel(
                 plot_UI(id  = "metrics")
                 
               )
             )
    ),
    tabPanel("Products Metrics"),
    tabPanel("Customer Metrics"),
    tabPanel("City Metrics")
  )
)

# server -----

server <- function(input, output, session) {
  
  # Graph in Performance Over Time ----
  
  # collect metric by user
  selected_metrics <- reactive({
    daily_metrics_no |> select(all_of(c("order_placement_date" ,
                                        input$metrics)))
  })
  

    plot_Server(id = "metrics", 
                data = selected_metrics, 
                date_var = "order_placement_date", 
                y_var = reactive(input$metrics))

  
}

shinyApp(ui, server)

@nirgrahamuk thank you soo much. I would also like to ask one more thing

What does !!sym do here? I have seen it the first time.
x = !!sym(date_var)

sym turns a string like "myvar" into a symbol, and the bang-bang operator evaluates it; i.e. gets at the contentx of what myvar contains. I prefer it to the embrace operators {{ }} as I can consistently make !!sym() work when I needed to , but half the time {{ }} it seems this doesnt work and I can't tell easily why....
This might be something I need to work on, but its been easier for me to just write working code and not worry about not using {{ }} so much.

This error is likely coming from your call to as.Date() where you did not provide the format so you would want to add the format argument to as.Date(). In your case if the date format is "2022-03-02" you would try
as.Date({{ date_var }}, format = '%Y-%m-%d')

You need to tell as.Date() what date format the character string is in, in your case this is given by %Y-%m-%d

You can look up these format codes with ?strptime and they are explained in the info/help document.

This topic was automatically closed 7 days after the last reply. New replies are no longer allowed.

If you have a query related to it or one of the replies, start a new topic and refer back with a link.