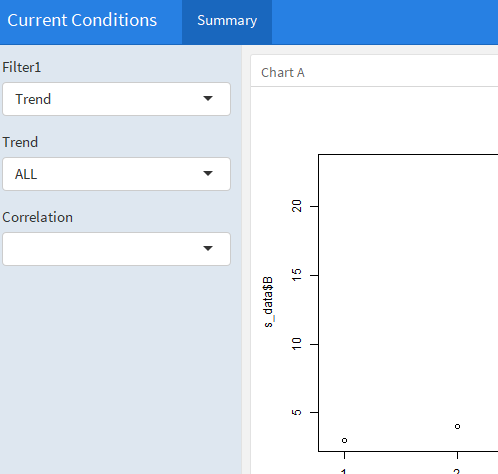
I have a dataframe df. I have executed half the code like below. With this code what I get is 3 filters
Now When I select Trend in Filter1, there is a plot displayed in chart A. With this plot, when i change values in below filter(Trend), the plot is getting changed, This is fine for me.
What I want is, in Filter1 if Trend is selected, the name of the below Filter should get changed to Trend and also its values should be changed to as per whatever is given in UI.(Something like below).
So if I select Correlation in FIlter1 the name of the below filter should get changed to Correlation and its values as well. In other words, I do not need 3rd Filter here. Also in correlation filter, there is a combination of all possible factors. So when I select C&D the plot should show the relation between A and B and so on.
Below is the original code
   ---
  title: Current Conditions
   output:
   flexdashboard::flex_dashboard:
   orientation: columns
   vertical_layout: scroll
   runtime: shiny
   source_code: embed
   theme: cosmo
    ---

   ```{r global}
   library(flexdashboard)
   library(readxl)
   library(tidyverse)
   library(lubridate)
   library(ggplot2)
   library(reshape)
   library(shiny)
    library(plotly)
    ```

   ```{r}
   df <- structure(list(A = c(1, 2, 3, 4, 5, 6, 7), B = c(3, 4, 5, 12,
   23, 12, 13), C = structure(c(1L, 1L, 1L, 2L, 2L, 2L, 3L), .Label = c("A",
   "B", "C"), class = "factor"), D = structure(c(2L, 2L, 1L, 1L,
   3L, 3L, 3L), .Label = c("A", "B", "C"), class = "factor")), class = "data.frame", row.names =             c(NA,
   -7L))
   df <- as.data.frame(df)
   ```

   Summary
  =================

  Inputs {.sidebar}
  -----------------------------------------------------------------------

  ```{r}
    selectInput("c","Filter1",choices = c("","Trend","Correlation"))
    selectInput("b","Filter2",choices = c("ALL",levels(factor(df$C))))
    selectInput("d","Correlation",choices = c("",combn(names(df),2,paste,collapse="&")))
  ```


  Column {data-width=350}
  -----------------------------------------------------------------------

  ### Chart A

  ```{r}
  plotOutput("p1")
  output$p1 <- renderPlot({
     if (input$c == "Trend"){
    s_data <- df
      }
  if (input$c == "Trend" && input$b != "ALL") {
      s_data <- s_data %>%
          filter(C %in% input$b)
  }
    plot(s_data$A,s_data$B)
  })
  ```


  ```
Hope my question is clear