Hello everyone,
I'm having some trouble with the Legend and color in ggplot2:
The following code works fine when I try to generate a plot without a colour:
library(dplyr)
#>
#> Attaching package: 'dplyr'
#> The following objects are masked from 'package:stats':
#>
#> filter, lag
#> The following objects are masked from 'package:base':
#>
#> intersect, setdiff, setequal, union
library(ggplot2)
#> Registered S3 methods overwritten by 'ggplot2':
#> method from
#> [.quosures rlang
#> c.quosures rlang
#> print.quosures rlang
library(tidyr)
library(scales)
set.seed(500)
Data1 <- data.frame(
TXT = sample(1:4,50, replace = TRUE),
YEAR_OF_DIAGNOSIS = sample(2004:2015,50, replace = TRUE)
)
dfr1<- Data1 %>%
mutate(TXT= as.factor(TXT))
dfr_perc1 <- dfr1 %>%
group_by(YEAR_OF_DIAGNOSIS) %>%
count(TXT,YEAR_OF_DIAGNOSIS) %>%
mutate(perc1=prop.table(n)*100)
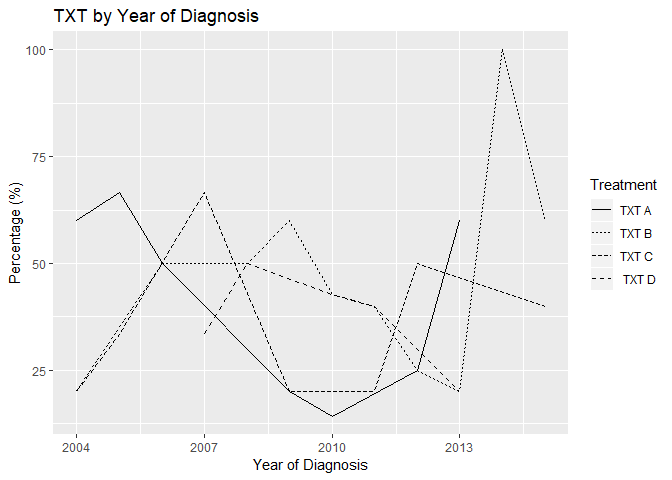
gg_perc1 <-ggplot(dfr_perc1, aes(x=YEAR_OF_DIAGNOSIS, y=perc1, group=TXT)) + geom_line(aes(linetype=TXT))
gg_perc1<- gg_perc1+ labs(title ="TXT by Year of Diagnosis", x = "Year of Diagnosis", y = "Percentage (%)") + scale_linetype_discrete(breaks=c(1,2,3,4), name = "Treatment", labels = c( "TXT A ","TXT B", "TXT C", " TXT D"))
gg_perc1
Created on 2019-06-17 by the reprex package (v0.3.0)
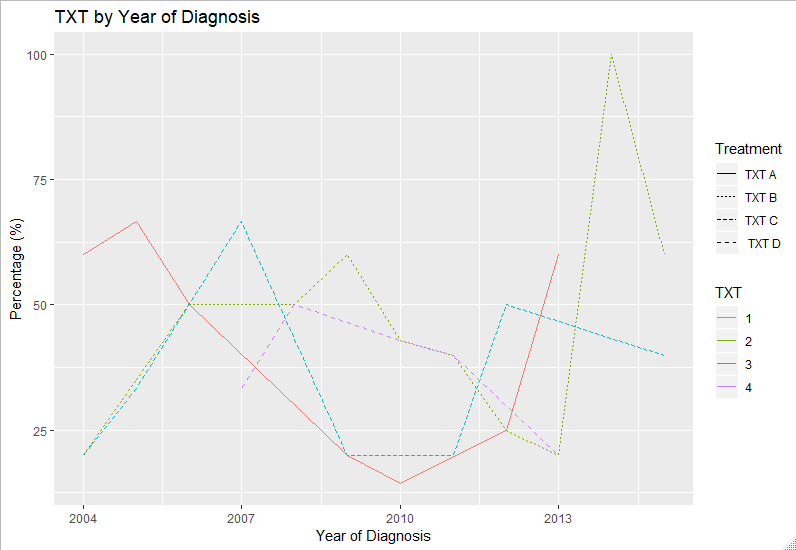
But when I try to add a color, this happens:
gg_perc1 <-ggplot(dfr_perc1, aes(x=YEAR_OF_DIAGNOSIS, y=perc1, group=TXT, colour=TXT)) +     geom_line(aes(linetype=TXT))
#> Error in ggplot(dfr_perc1, aes(x = YEAR_OF_DIAGNOSIS, y = perc1, group = TXT, : could not find function "ggplot"
gg_perc1<- gg_perc1+ labs(title ="TXT by Year of Diagnosis", x = "Year of Diagnosis", y = "Percentage (%)") + scale_linetype_discrete(breaks=c(1,2,3,4), name = "Treatment", labels = c( "TXT A ","TXT B", "TXT C", " TXT D"))
#> Error in eval(expr, envir, enclos): object 'gg_perc1' not found
gg_perc1
#> Error in eval(expr, envir, enclos): object 'gg_perc1' not found
Created on 2019-06-17 by the reprex package (v0.3.0)
Any ideas?