Changing Colour Palette

I was given a sample code and came across the point of setting the colour palette, I was wondering how I could change the colour palettes for my graphs and also what the numbers result for in the saved colour variables:

colours <- c("#330000", "#594c16", "#6cd9b5", "#0000ff", "#b32d86", "#d91d00", "#f2e6b6", "#006652", "#000066", "#d9a3bf", "#cc7466", "#eeff00", "#394d4b", "#333366", "#7f0033", "#59392d", "#6b7300", "#6cd2d9", "#8979f2", "#e5003d", "#ffd0bf", "#caf279", "#1d6273", "#732699", "#f27999", "#f2aa79", "#5a664d", "#3db6f2", "#524359", "#7f0011", "#a65800", "#004d00", "#001b33", "#cc00ff", "#592d33", "#a68a53", "#00ff22", "#296ca6", "#2b0d33", "#e5b800", "#2db33e", "#a3aad9", "#f780ff")
colours2 <- c("#4363d8", "#f58231", "#911eb4",
"#e6194B", "#3cb44b", "#ffe119",
"#42d4f4", "#f032e6", "#bfef45",
"#fabebe", "#469990", "#e6beff",
"#9A6324", "#fffac8", "#800000",
"#aaffc3", "#808000", "#ffd8b1",
"#000075", "#a9a9a9", "#ffffff",
"#000000")

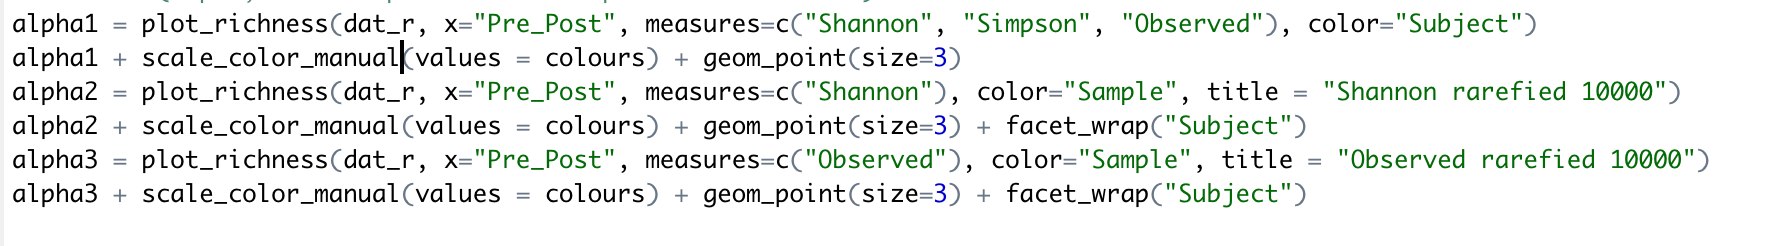
Also, I was wondering if someone could explain the results of the following code as I had no luck with searching its corresponding outcome (attachment)

Hi,

The strings in the colours variable are the HEX values of each colour, just paste any of them into google (without the quotes) and it'll show you the colour. There are many tools out there that let you pick a colour and generate its code if you like.

For explaining the rest of the code, the plot_richness is a function that acts like ggplot and creates a graph based on data. See the details on its page. It actually has a built in 'color' argument where you can set the color of all the points, or provide it a vector (as long as the input) to colour each point individually.

scale_color_manual is a ggplot function that overrides the default color settings of the previous functions in ggplot and lets you assign your own colours per group. Note that in the plot_richness function, color="Sample", meaning points of the same Sample will have the same colour. But to define that colour yourself, you can then use scale_colour_manual if you don't like ggplot's default colours.

Finally, instead of manually selecting each colour like defined here in the first part of the code, you can use packages like colorspace or RcolorBrewer to help you

Hope this answers your questions
PJ

Hi,

When coding in R and dealing with colors I have the following cheat sheet at my side. If you want to learn more about color that's a good starting point.

Regards,

jm

This topic was automatically closed 21 days after the last reply. New replies are no longer allowed.