I have the following CSV data showing the mean and standard error of ammonia concentrations for 10 sites.
 Site, Mean, StdEr
CountyUS_Wet, 0.01, 0.00
CountyUS_Dry, 0.23, 0.10
CountyDS_Wet,   0.01,  0.00
CountyDS_Dry,  0.12,  0.05
CountyOF_Wet, 0.11,  0.10
CountyOF_Dry, 0.25, 0.13
CastleOF_Wet, 0.14, 0.12
CastleOF_Dry, 0.86, 0.61
CourtOF_Wet, 0.06, 0.05
CourtOF_Dry, 0.49, 0.15
I uploaded this data into R and and created a barplot using the code:
windowsFonts(A = windowsFont("Times New Roman"))
par(family = "serif")

NH4plot <- barplot(data.dat$NH4Mean, ylim = c(0,1.6), family = "A", xlab = "Sample Location", ylab = "NH4 Concentration (mg/L)", col = c('Grey', 'White', 'Grey', 'White', 'Grey', 'White', 'Grey', 'White', 'Grey', 'White'))
axis(1, at = c(1.3, 3.7, 7.3, 10.8, 14.5), labels = c("BO1 US", "BO1 DS", "BO1", "BO2", "BO3"), family = "A")
arrows(x0 = NH4plot,
       y0 = data.dat$NH4Mean + data.dat$NH4StEr,
       y1 = data.dat$NH4Mean - data.dat$NH4StEr,
       angle = 90,
       code = 3,
       length = 0.1)
legend(1, 1.5, legend = c("Wet Weather", "Dry Weather"), fill = c("Grey", "White"), bty = "n")
This code produced the following plot:
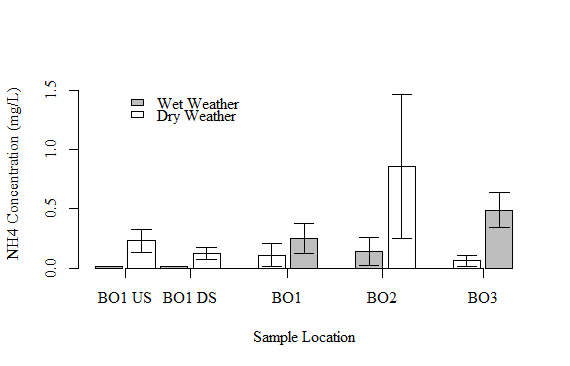
As shown in the plot, there is a large variation in the NH4 concentrations among sites and a logarithmic scale would better represent the low concentrations shown in some of the bars.
I am currently trying to change the scale of the y-axis to be logarithmic, but not having much success. Does anyone have any advice on how to show my y-axis on a logarithmic scale? TIA