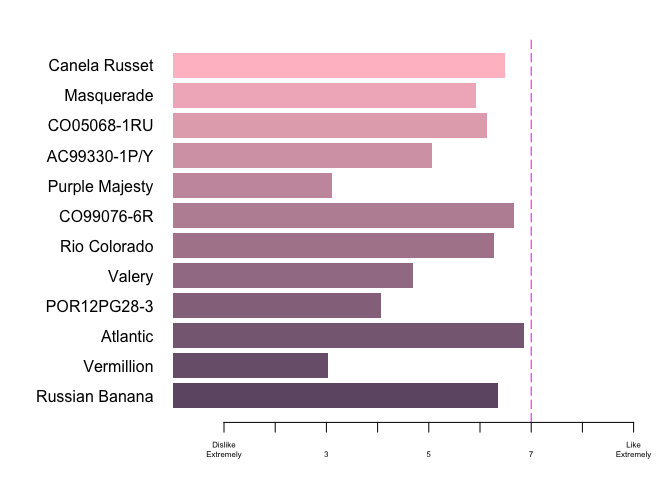
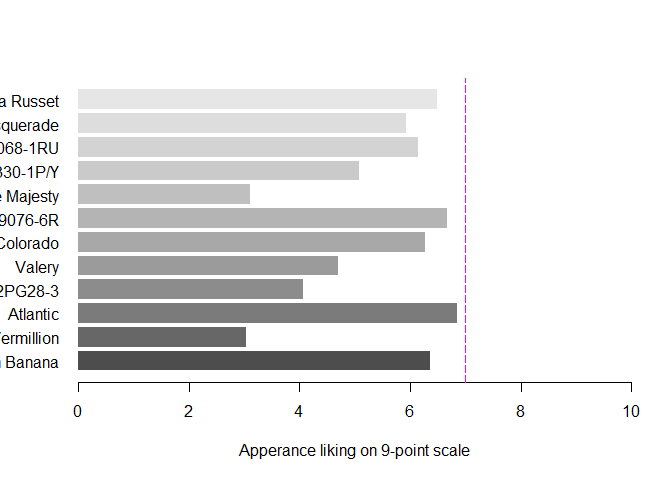
Hello, If someone can please help me to change x-axis intervals, I want a difference of 1 in between x-axis ticks. Also how i can use palette="pastel" for color?
Here is code:
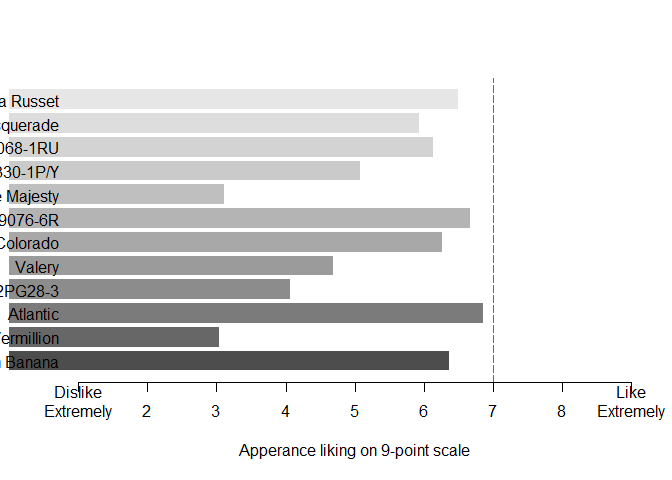
H <- c(6.36, 3.03, 6.85, 4.07, 4.69, 6.27, 6.67, 3.11, 5.07, 6.14, 5.93, 6.49)
barplot(H,
        xlab = "Apperance liking on 9-point scale",
        ylab = "",
        xlim = c(0, 10),
        names.arg = c("Russian Banana", "Vermillion", "Atlantic", "POR12PG28-3", "Valery",
                      "Rio Colorado", "CO99076-6R", "Purple Majesty", "AC99330-1P/Y",
                      "CO05068-1RU", "Masquerade", "Canela Russet"),
        col = grey.colors(12),
        font.axis = 2,
        horiz = TRUE, las=1, font.lab=1, font.axis=1, border = NA)
abline(v=7, col = "magenta", lty = 5)
Created on 2020-07-13 by the reprex package (v0.3.0)