This is a crosspost.
When using a colorscale on a treemap trace (without providing a root) the container is shown in black:
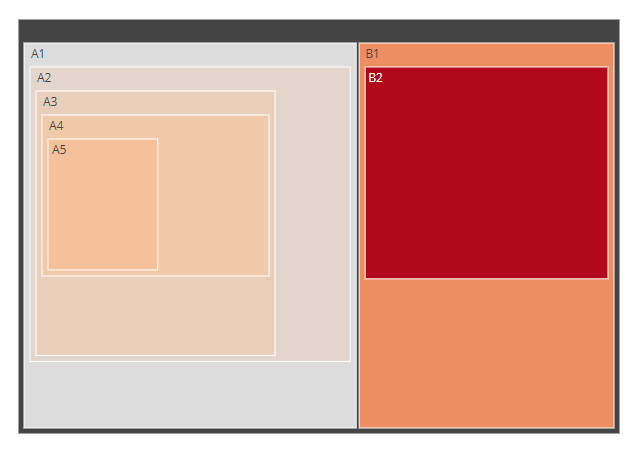
library(plotly)

labels = c("A1", "A2", "A3", "A4", "A5", "B1", "B2")
parents = c("", "A1", "A2", "A3", "A4", "", "B1")
values = c("11", "12", "13", "14", "15", "20", "30")

fig <- plot_ly(
  type="treemap",
  labels=labels,
  parents=parents,
  values=values,
  marker=list(colorscale='Reds'))

fig
Example taken from here: Treemap charts in R
I'd like to change it to white.
In the python plotly library there is a root_color argument to do so:
fig.update_traces(root_color="lightgrey")
Is there any workaround to achive this in R? I can't find the according option.