dataset is as follows:
data.frame(
stringsAsFactors = FALSE,
ID = c(10,11,12,13,14,15,16,17,
18,19,20,21,22,23,24,25,26,27,28,29),
Rescan1 = c("Yes","No","No","No","No",
"No","No","No","No","No","No","No","Yes","No",
"No","No","Yes","No","No","No")
)
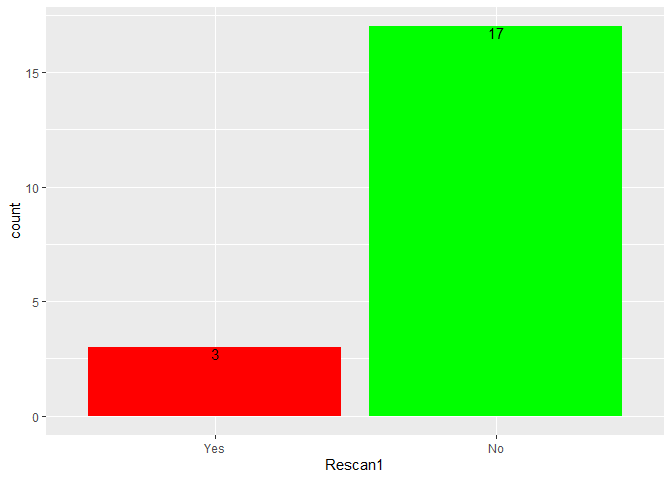
I have created two barcharts using thiscode
ggplot(prostate_cleaned, aes(x=Rescan1, fill=Rescan1)) + geom_bar()+scale_fill_manual(values = c("green", "red")) + geom_text(stat= 'count', aes(label=..count.., vjust=1))
I want to do the following:
- Add in proprtions on the Y axis rather than counts. entering the code below made me lose the colors - turned back to gray
ggplot(prostate_cleaned, aes(x=Rescan1, fill=Rescan1, y = ..prop.., group = 1)) + geom_bar()+scale_fill_manual(values = c("green", "red")) + geom_text(stat= 'count', aes(label=..count.., vjust=1))
- Also, I wish to change the order of the bar plots - i.e. I want the 'Yes' (count = 3) Bar chart (, to be displayed first then the 'No' Bar Chart.
I'm challenging myself to find solutions to this..but clearly struggling. Merci.