I have a boxplot with an extreme outlier. I'd prefer not to change the scale or remove the outlier, rather just change the range and add an indicator arrow or the likes with the value.
Is it possible to do something similar to answer 2 from this SO question in ggplot?
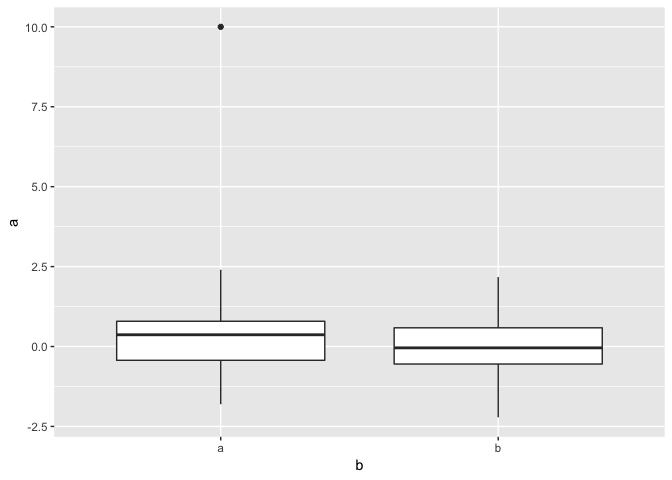
E.g. in the plot below the range of y would go to ~ 2.5 and an arrow with a value would indicate the presence of an outlier in a.
``` r
library(tidyverse)
set.seed(1)
Df <- tibble(a = rnorm(100),
             b = rep(c("a", "b"), 50))

Df$a[1] <- 10


Df %>%
ggplot(aes(b, a)) +
  geom_boxplot()
Created on 2018-12-14 by the reprex package (v0.2.1)