nbaes
February 4, 2022, 12:20am
1
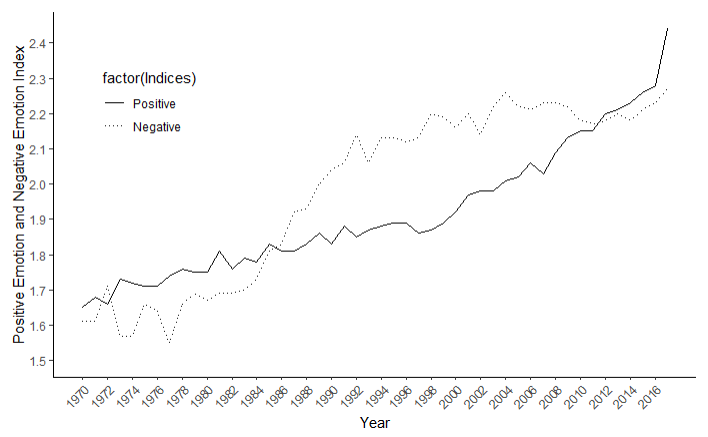
Context: I am trying to change the legend labels for the Indices variable which contains "Positive" and "Negative" in d_posneg data frame.
Problem: However, my attempts have not yet worked. At present this is the code line that I am attempting to rename labels with in the graph below (line 6 of the ggplot):
scale_fill_discrete(name = "Indices", labels = c("Positive Emotion", "Negative Emotion")) +
Question: Does anyone know how to solve this?
See attached file for plot
and code below for more context:
lines <- c("Positive" = "solid", "Negative" = "dotted")

fig1_1 <- d_posneg %>% # plot `posemo` and `negemo`
  ggplot(mapping = aes(x=year, y=rel_freq, linetype=factor(Indices))) +
  geom_line(alpha=1, size=0.7) +
  theme_classic() +
  scale_linetype_manual(values=lines) +
  scale_fill_discrete(name = "Indices", labels = c("Positive Emotion", "Negative Emotion")) +
  labs(x="Year", y="Positive Emotion and Negative Emotion Index") +
  scale_x_continuous(breaks=seq(1970,2017,2)) +
  expand_limits(y=1.5) +
  scale_y_continuous(breaks=seq(0.0,3, 0.1)) +
  theme(axis.text.x=element_text(angle=45, hjust=1)) +
  theme(legend.position=c(0.15,0.75))
print(fig1_1)
Perhaps:
Your code +
or:
Your code +
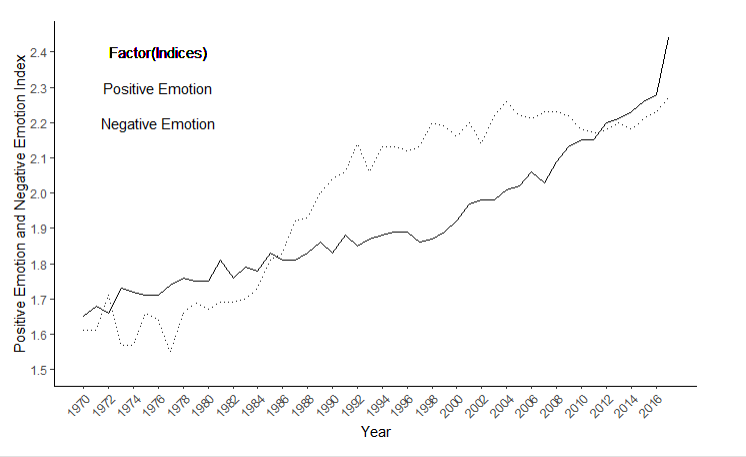
Maybe.. you can add:
geom_text(aes(x = 1976, y = 2.4 label = "Factor(Indices)")
nbaes
February 4, 2022, 2:05am
4
bustosmiguel:
annotate(
Thanks @bustosmiguel -- the issue with that strategy is that I merely want to rename labels in the legend and keep the key. The image shows how the the legend key would need to be removed.
FJCC
February 4, 2022, 2:59am
5
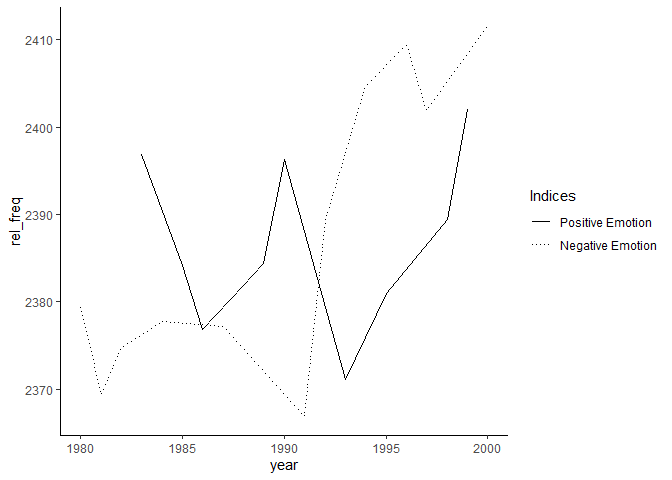
Moving all of the arguments to scale_linetype_manual() seems to work.
library(ggplot2)
d_posneg <- data.frame(year=seq(1980,2000,1),
                       rel_freq=seq(1980,2000,1)*1.2+rnorm(21,0,10),
                       Indices=sample(c("Positive","Negative"),21,replace = TRUE))
lines <- c("Positive" = "solid", "Negative" = "dotted")

 # plot `posemo` and `negemo`
  ggplot(d_posneg,mapping = aes(x=year, y=rel_freq, linetype=factor(Indices))) +
  geom_line(alpha=1, size=0.7) +
  theme_classic() +
  scale_linetype_manual(values=lines,name = "Indices",
                        labels = c("Positive Emotion", "Negative Emotion"))
Created on 2022-02-03 by the reprex package (v2.0.1)
nbaes
February 4, 2022, 5:01am
6
Wow, so simple. Thank you very much @FJCC ! I need to better learn the grammar.
This is the updated code with the solution:
lines <- c("Positive" = "solid", "Negative" = "dotted")

fig1 <- d_posneg %>% # plot `posemo` and `negemo`
  ggplot(mapping = aes(x=year, y=rel_freq, linetype=factor(Indices))) +
  geom_line(alpha=1, size=0.7) +
  theme_classic() +
  scale_linetype_manual(values=lines, name="Indices", labels=c("Positive Emotion", "Negative Emotion")) +
  labs(x="Year", y="Positive Emotion and Negative Emotion Index") +
  scale_x_continuous(breaks=seq(1970,2017,2)) +
  expand_limits(y=1.5) +
  scale_y_continuous(breaks=seq(0.0,3, 0.1)) +
  theme(axis.text.x=element_text(angle=45, hjust=1)) +
  theme(legend.position=c(0.15,0.75))
print(fig1)
system
February 25, 2022, 5:02am
7
This topic was automatically closed 21 days after the last reply. New replies are no longer allowed.