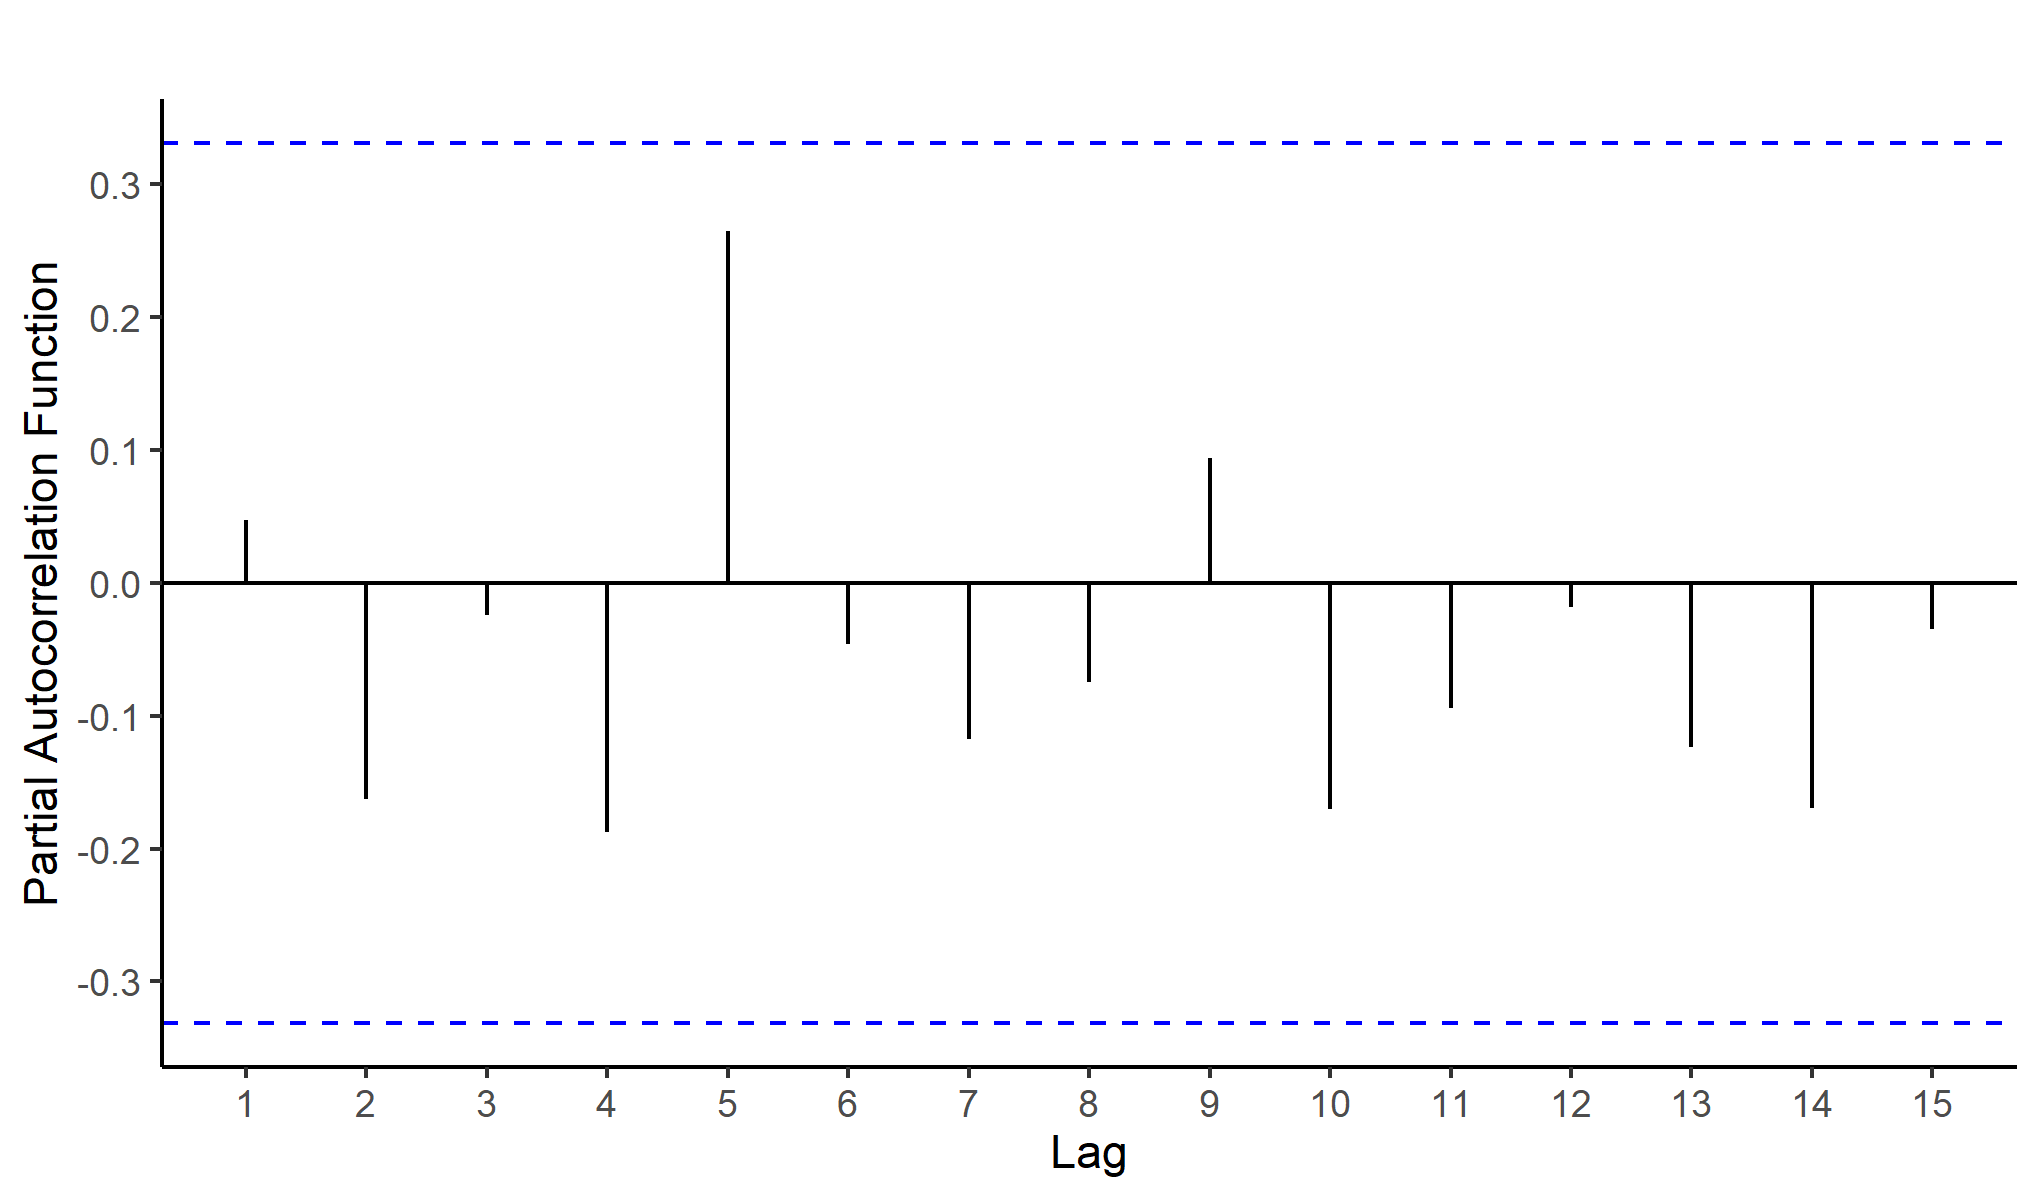
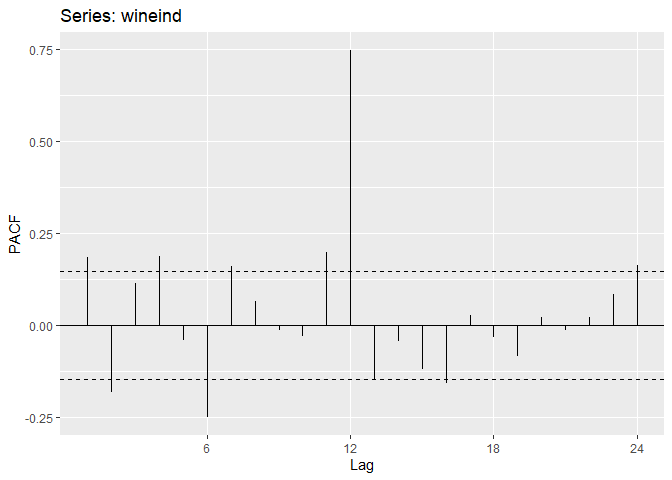
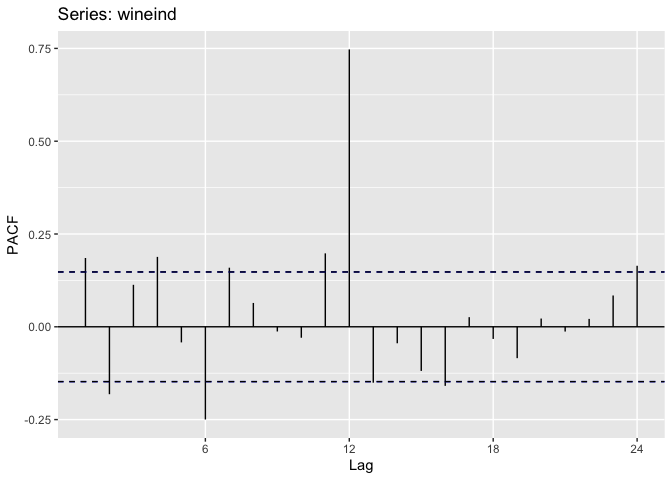
Would anyone know how to change the colour of the confidence interval bands to black in this ggplot (using the ggPacf function)? Code below and output attached
Thank you very much for your replies and sorry for not being specific about the package related to the function. This has worked, and makes sense. I thought there might be an argument I am missing in ggplot but it is better to manually compute ci.
I now wonder what inference I can draw about pacf values for an ardl model - especially if out of bounds @EconProf@FactOREO ?