Hello!
I have this here interactive map and I'm trying to change the color scheme so that 0 is red and 4 is green.
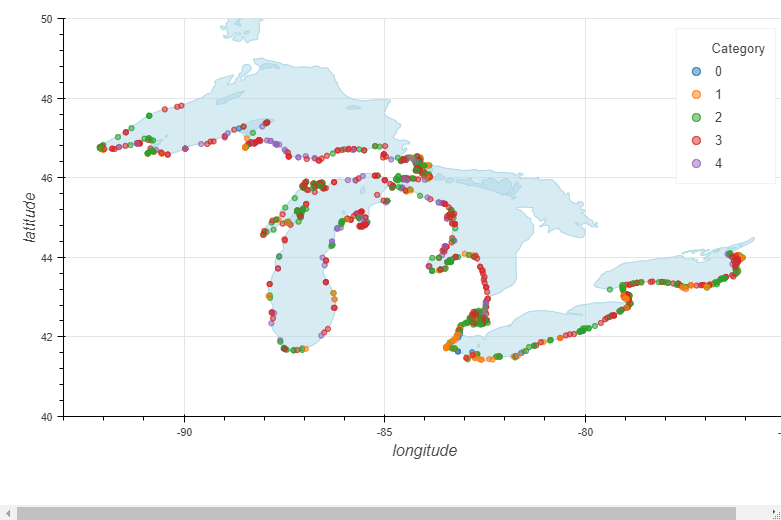
Currently when I set the color to "Category" it has a default scheme that does not visually represent what I'm trying to convey. Here is the original code:
library(rbokeh)
library(maps)
plot2 <- suppressWarnings(figure(width = 800, height = 450, padding_factor = 0, xlim = c(-93,-75), ylim=c(40,50)) %>%
                            ly_map("lakes", col = "lightblue") %>%
                            ly_points(LONGITUDE, LATITUDE, data = indices3, size = 5, col=Category,
                                      hover = c(UID, SITE_ID, Water_Quality_Index, Sed_Chem_Index,
                                                Sed_Tox_Index, OTI_Classification, Category)))
I then tried to manually change it by creating a vector of color names:
colors <- c("red", "orange", "yellow", "blue", "green")
And then setting the color argument to my color vector:
plot2 <- suppressWarnings(figure(width = 800, height = 450, padding_factor = 0, xlim = c(-93,-75), ylim=c(40,50)) %>%
                            ly_map("lakes", col = "lightblue") %>%
                            ly_points(LONGITUDE, LATITUDE, data = indices3, size = 5, col=colors,
                                      hover = c(UID, SITE_ID, Water_Quality_Index, Sed_Chem_Index,
                                                Sed_Tox_Index, OTI_Classification, Category)))
But alas, it did not work (and I didn't really think it would because I want the colors to align with the categories and not simply be unassigned colors). Anyone have an idea on how I can achieve this?
Here is a subset of my data:
indices3 <- structure(list(UID = c("155230", "155231", "155232", "155233",
"155233", "155233", "155233", "155233", "155233", "155233", "155233",
"155234", "155234", "155234", "155234"), SITE_ID = c("LHLEC-012",
"LHLEC-015", "LHLEC-011", "LHLEC-003", "LHLEC-003", "LHLEC-003",
"LHLEC-003", "LHLEC-003", "LHLEC-003", "LHLEC-003", "LHLEC-003",
"LHLEC-004", "LHLEC-004", "LHLEC-004", "LHLEC-004"), LATITUDE = c(42.0855,
42.1436, 42.1203, 42.1725, 42.1725, 42.1725, 42.1725, 42.1725,
42.1725, 42.1725, 42.1725, 42.0461, 42.0461, 42.0461, 42.0461
), LONGITUDE = c(-83.1216, -83.1177, -83.1328, -83.1316, -83.1316,
-83.1316, -83.1316, -83.1316, -83.1316, -83.1316, -83.1316, -83.1844,
-83.1844, -83.1844, -83.1844), Water.Quality.Index = c("Fair",
"Poor", "Fair", "Good", "Good", "Good", "Good", "Good", "Good",
"Good", "Good", "Poor", "Fair", "Poor", "Fair"), SedChemindex = c("Fair",
"Good", "Fair", "Good", "Good", "Good", "Good", "Good", "Good",
"Good", "Good", "Good", "Good", "Good", "Good"), SEDTOX_INDEX = c("Fair",
"Good", "Fair", "Good", "Good", "Fair", "Fair", "Good", "Good",
"Fair", "Fair", "Poor", "Poor", "Good", "Good"), OTI.Classification = c("Missing",
"Fair", "Poor", "Fair", "Fair", "Fair", "Fair", "Fair", "Fair",
"Fair", "Fair", "Poor", "Poor", "Poor", "Poor"), Category = c(0,
2, 0, 3, 3, 2, 2, 3, 3, 2, 2, 1, 1, 2, 2)), row.names = c(NA,
15L), class = "data.frame")
Thanks so much!