Hi.
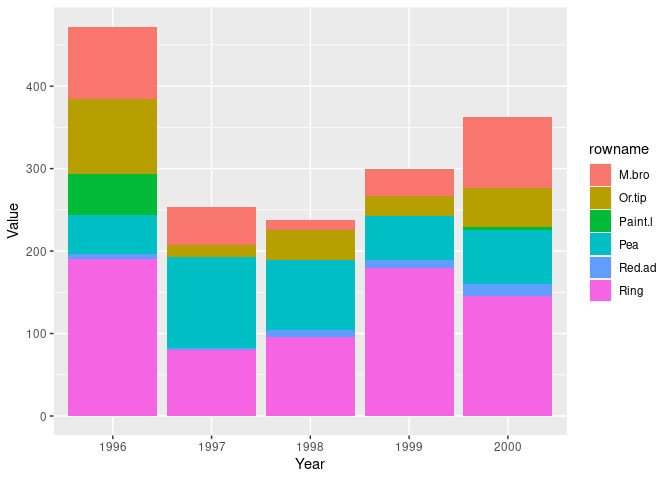
I have a dataset as a data.frame and I want to create a barplot from it. But then I first need to make it into a matrix. When I make it into a matrix class, the values are for whatever reason changed from integer to character. Is there any way to change the character values into numeric, without altering the row/column names? Or is it possible to create a matrix from a data.frame without the values being changed to character...?
My data (as a data.frame):
data.frame(
stringsAsFactors = FALSE,
check.names = FALSE,
row.names = c("M.bro", "Or.tip", "Paint.l", "Pea", "Red.ad", "Ring"),
1996= c(" 88", " 90", " 50", " 48", " 6", "190"),
1997= c(" 47", " 14", " 0", "110", " 3", " 80"),
1998= c("13", "36", " 0", "85", " 8", "96"),
1999= c(" 33", " 24", " 0", " 54", " 10", "179"),
2000= c(" 86", " 47", " 4", " 65", " 15", "145")
)

