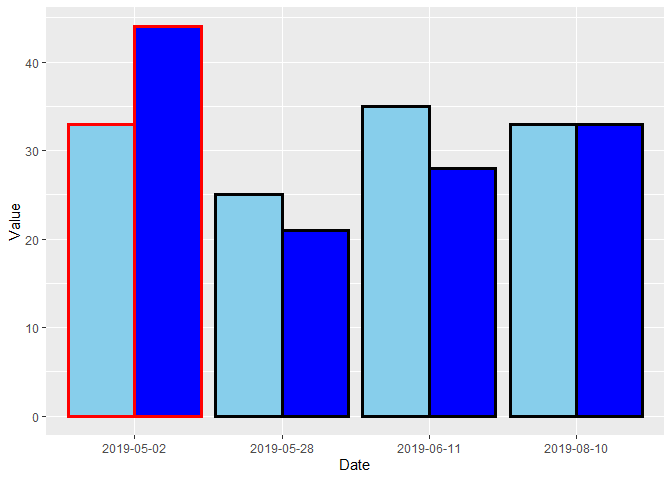
Here is a manual method using the color aesthetic.
library(ggplot2)
library(dplyr, warn.conflicts = FALSE)
DF <- data.frame(Date = rep(c("2019-05-02", "2019-05-28", "2019-06-11", "2019-08-10"), each = 2),
                 Value = c(33, 44, 25, 21, 35, 28, 33, 33),
                 Pop = rep(c("A", "B"), 4))
DF <- DF %>% mutate(Highlight = ifelse(Date == "2019-05-02", "May_2", "Not_May_2"))
Fill_COLORS = c("A" = "skyblue", "B" = "blue")
Colors = c("May_2" = "red", "Not_May_2" = "black")
ggplot(DF, aes(Date, Value, fill = Pop, color = Highlight)) +
  geom_col(position = "dodge", size = 1.2) +
  scale_fill_manual(values = Fill_COLORS) +
  scale_color_manual(values = Colors) +
  guides(color = FALSE, fill = FALSE)
Created on 2020-07-12 by the reprex package (v0.3.0)