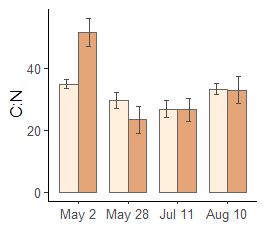
Hello, I am making a simple column chart, I use aes(fill = ) to plot 2 categories by date. And I also want to somehow highlight the first two columns (change color or add hatching?) associated with the first date (May 2). Is there an easy way to do this? Thanks!
FJCC
July 12, 2020, 1:12pm
3
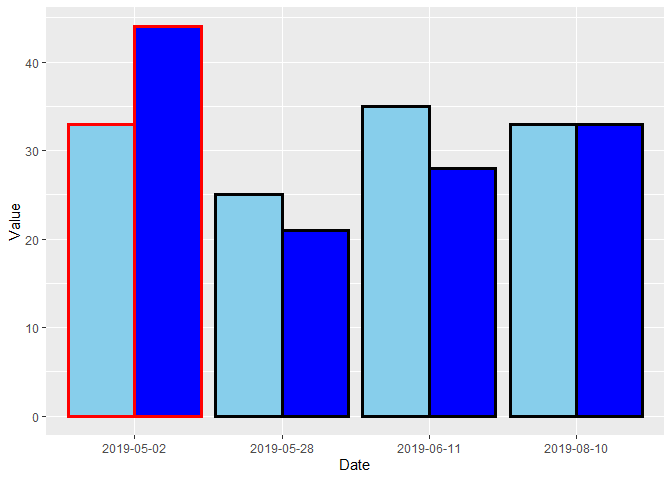
Here is a manual method using the color aesthetic.
library(ggplot2)
library(dplyr, warn.conflicts = FALSE)
DF <- data.frame(Date = rep(c("2019-05-02", "2019-05-28", "2019-06-11", "2019-08-10"), each = 2),
                 Value = c(33, 44, 25, 21, 35, 28, 33, 33),
                 Pop = rep(c("A", "B"), 4))
DF <- DF %>% mutate(Highlight = ifelse(Date == "2019-05-02", "May_2", "Not_May_2"))
Fill_COLORS = c("A" = "skyblue", "B" = "blue")
Colors = c("May_2" = "red", "Not_May_2" = "black")
ggplot(DF, aes(Date, Value, fill = Pop, color = Highlight)) +
  geom_col(position = "dodge", size = 1.2) +
  scale_fill_manual(values = Fill_COLORS) +
  scale_color_manual(values = Colors) +
  guides(color = FALSE, fill = FALSE)
Created on 2020-07-12 by the reprex package (v0.3.0)
2 Likes
Z3tt
July 13, 2020, 7:05am
4
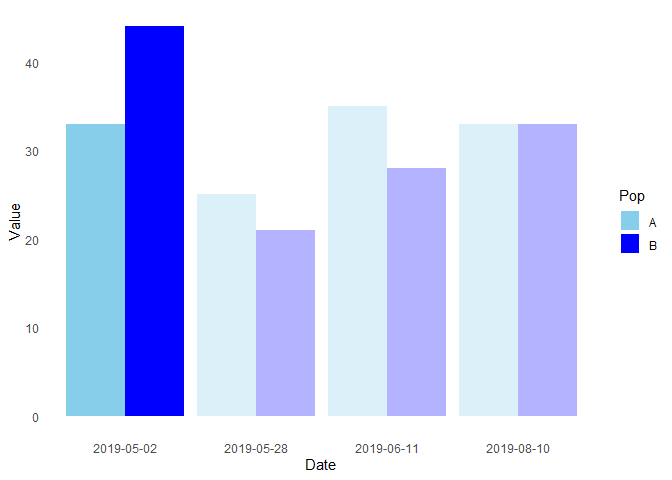
In case you do not use gridlines you could also use transparency:
library(ggplot2)
library(dplyr, warn.conflicts = FALSE)
DF <- data.frame(Date = rep(c("2019-05-02", "2019-05-28", "2019-06-11", "2019-08-10"), each = 2),
                 Value = c(33, 44, 25, 21, 35, 28, 33, 33),
                 Pop = rep(c("A", "B"), 4))
DF <- DF %>% mutate(Highlight = ifelse(Date == "2019-05-02", "May_2", "Not_May_2"))

Fill_COLORS = c("A" = "skyblue", "B" = "blue")

ggplot(DF, aes(Date, Value, fill = Pop, alpha = Highlight)) +
  geom_col(position = "dodge", size = 1.2) +
  scale_fill_manual(values = Fill_COLORS, name = "Pop") +
  scale_alpha_manual(values = c(1, .3), guide = F) +
  theme_minimal() +
  theme(panel.grid = element_blank())
Created on 2020-07-13 by the reprex package (v0.3.0)
system
July 20, 2020, 7:08am
5
This topic was automatically closed 7 days after the last reply. New replies are no longer allowed.