Hello,
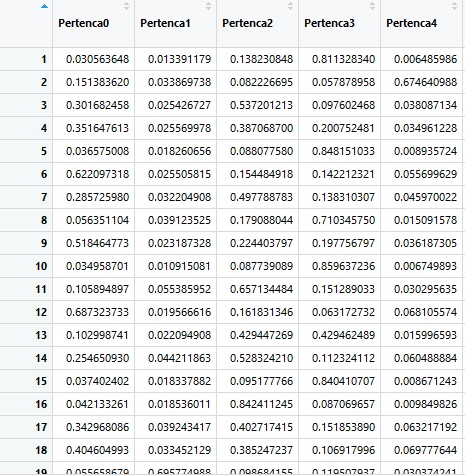
Im new to RStudio and R language. Im use a function called fuzzyplot from the package VisuClust. One of the arguments required is probs. In the example given in FuzzyPlot function - RDocumentation they use an function fanny to get the probs but i want to use my own membership matrix(probs). So i imported a csv file with the collums corresponding to the probs:
But when i try to use these probs i get this error:
FuzzyPlot(S$points, F, labels=labels1,
-
clusterColors=c("red", "green", "magenta", "yellow", "blue"))
Error in rgb(rgblist[1, i]/255, rgblist[2, i]/255, rgblist[3, i]/255, :
(list) object cannot be coerced to type 'double'
Error in rgb(rgblist[1, i]/255, rgblist[2, i]/255, rgblist[3, i]/255, :
(list) object cannot be coerced to type 'double'
Here's the script:
library(cluster)
library(MASS)
library(aplpack)
library(VisuClust)
library(tcltk2)
M <- scale(tabela_norte_litoral_R2[7:12])
D <- dist(M)
S <- sammon(D)
F <- tabela_norte_litoral_R2[1:5]
labels1=unlist(tabela_norte_litoral_R[,6])
FuzzyPlot(S$points, F, labels=labels1,
clusterColors=c("red", "green", "magenta", "yellow", "blue"))
tabela_norte_litoralR[1:5] are the collumns of the data imported that i wanted to use. I think the problems i'm not converting tabela_norte_litoralR[1:5] to correct format so it can be used is FuzzyPlot but i'm not quite sure.
Thanks in advance.