I'm brand new at coding so this ggplot2 code may look like crap:
ggplot2(phylum.t2.dca, display = "site", choices = 1:2, pch = c(15, 16, 17), col = point_colors) + ggrepel::geom_text_repel(aes(phylum.t2.dca))
Here is my full code:
#Updated DCA Analyses
WD <- "C:/Users/"
setwd(WD)
require(vegan)
phylum.dat <- read.csv("Phylum data for R.csv", stringsAsFactors = T, header = T, row.names = 1) # preform dca on data set
phylum.t1 <- decostand(phylum.dat, "total") # percent transformation on samples; “total” method defaults to rows (samples)
phylum.t2 <- decostand(phylum.t1, "max") # percent of maximum transformation on taxa; “max” method defaults to columns (taxa)
phylum.t2.dca <- decorana(phylum.t2) # default ira=0 specifies DCA
phylum.t2.dca.DW <- decorana(phylum.t2, iweigh = 1) # iweigh=1 turns on down-weighting of rare taxa, dampening their effects on the ordination
names(phylum.t2.dca) # view items in list produced by decorana
summary(phylum.t2.dca) # view summary of dca results
phylum.t2.dca.taxonscores <- scores(phylum.t2.dca,display=c("species"), choices=c(1,2)) # extract scores from decorana output; extracts axis 1 & 2 scores for taxa
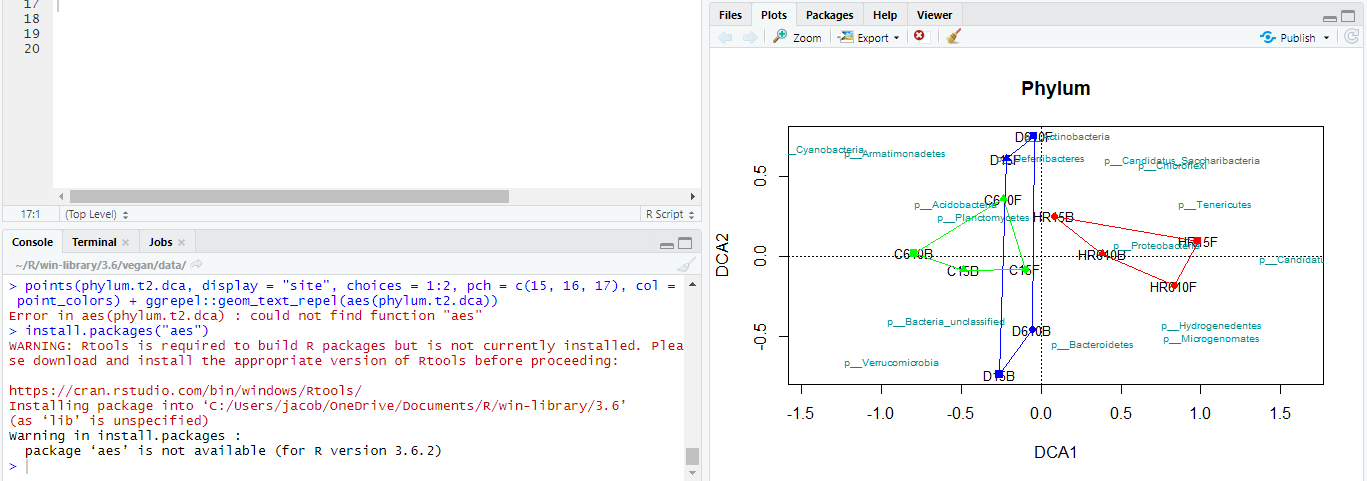
plot(phylum.t2.dca, display = "sites", type = "text", main = "Phylum") # adds site names
point_colors <- c(rep("blue", 4), rep("red", 4), rep("green", 4)) # assign colors
points(phylum.t2.dca, display = "site", choices = 1:2, pch = c(15, 16, 17), col = point_colors) # plot points
text(phylum.t2.dca, display = "species", choices = 1:2, cex = 0.6, col = "darkcyan") # plot labels for taxa
ggplot2(phylum.t2.dca, display = "site", choices = 1:2, pch = c(15, 16, 17), col = point_colors) + ggrepel::geom_text_repel(aes(phylum.t2.dca)) # separate label overlap