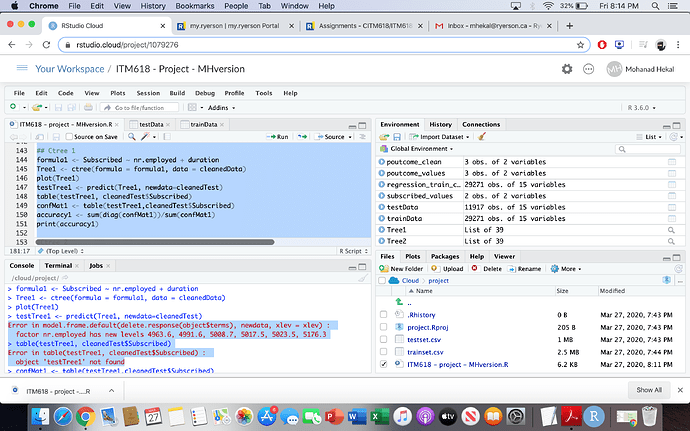
HI community, I am working on a school project and i get the following error messages after cleaning the data. Here is my full code
trainData <- read.csv("trainset.csv")
testData <- read.csv("testset.csv")
View(trainData)
View(testData)
install.packages("ggplot2")
install.packages("partykit")
install.packages("RWeka")
install.packages("caret")
install.packages("ROCR")
library(ggplot2)
library(partykit)
library(RWeka)
library(caret)
library(ROCR)
classes <- data.frame(age = class(trainData$age),
job = class(trainData$job),
marital = class(trainData$marital),
education = class(trainData$education),
housing = class(trainData$housing),
loan = class(trainData$loan),
contact = class(trainData$contact),
month = class(trainData$month),
day_of_week = class(trainData$day_of_week),
duration = class(trainData$duration),
campaign = class(trainData$campaign),
pdays = class(trainData$pdays),
poutcome = class(trainData$poutcome),
nr.employed = class(trainData$nr.employed),
Subscribed = class(trainData$Subscribed),
stringsAsFactors = FALSE)
plot1 <- ggplot(trainData, aes(age))
plot1 + geom_density(fill = "blue", alpha = 0.7)
plot2 <- ggplot(trainData, aes(duration))
plot2 + geom_density(fill = "green", alpha = 0.7)
plot3 <- ggplot(trainData, aes(campaign))
plot3 + geom_density(fill = "red", alpha = 0.7)
plot4 <- ggplot(trainData, aes(pdays))
plot4 + geom_density(fill = "pink", alpha = 0.7)
plot5 <- ggplot(trainData, aes(nr.employed))
plot5 + geom_density(fill = "white", alpha = 0.7)
summary(trainData$campaign)
campaign_values <- as.data.frame(table(trainData$campaign))
summary(trainData$pdays)
pdays_values <-as.data.frame(table(trainData$pdays))
summary(trainData$nr.employed)
nr.employed_values <- as.data.frame(table(trainData$nr.employed))
#Data Exploration for Factors
job_values <- as.data.frame(table(trainData$job))
job_values
marital_values <- as.data.frame(table(trainData$marital))
marital_values
education_values <- as.data.frame(table(trainData$education))
education_values
housing_values <- as.data.frame(table(trainData$housing))
housing_values
loan_values <- as.data.frame(table(trainData$loan))
loan_values
contact_values <- as.data.frame(table(trainData$contact))
contact_values
month_values <- as.data.frame(table(trainData$month))
month_values
day_of_week_values <- as.data.frame(table(trainData$day_of_week))
day_of_week_values
poutcome_values <- as.data.frame(table(trainData$poutcome))
poutcome_values
subscribed_values <- as.data.frame(table(trainData$Subscribed))
subscribed_values
#Info Gain Before Data Cleanup
IG_pre_cleanup <- sort(InfoGainAttributeEval(Subscribed ~ . , data = trainData), decreasing = TRUE)
barplot(IG_pre_cleanup , las=2)
Cleaning the Data
cleanedData <- trainData
cleanedData$nr.employed[cleanedData$nr.employed == "5176.3"] <- NA
cleanedData$nr.employed[cleanedData$nr.employed == "5017.5"] <- NA
cleanedData$job[cleanedData$job == "unknown"] <- NA
cleanedData$job[cleanedData$job == "student"] <- NA
cleanedData$marital[cleanedData$marital == "unknown"] <- NA
cleanedData$education[cleanedData$education == "unknown"] <- NA
cleanedData$education[cleanedData$education == "illiterate"] <- NA
cleanedData$housing[cleanedData$housing == "unknown"] <- NA
cleanedData$loan[cleanedData$loan == "unknown"] <- NA
cleanedData$month[cleanedData$month == "dec"] <- NA
cleanedData$month[cleanedData$month == "sep"] <- NA
cleanedData$month[cleanedData$month == "mar"] <- NA
cleanedData$month[cleanedData$month == "oct"] <- NA
cleanedData$month[cleanedData$month == "apr"] <- NA
cleanedData$poutcome[cleanedData$poutcome == "success"] <- NA
cleanedData$pdays[cleanedData$pdays == 999] <- NA
set nr.employed as factor
cleanedData$nr.employed <- as.factor(cleanedData$nr.employed)
Clean Numerical/Integer Data
regression_train_cleaned <- cleanedData
Clean testData
cleanedTest <- testData
regression_test_cleaned <- cleanedTest
cleanedTest$nr.employed <- as.factor(cleanedTest$nr.employed)
Check cleaned data for removed values
nr.employed_clean <- as.data.frame(table(cleanedData$nr.employed))
job_clean <- as.data.frame(table(cleanedData$job))
marital_clean <- as.data.frame(table(cleanedData$marital))
education_clean <- as.data.frame(table(cleanedData$education))
housing_clean <- as.data.frame(table(cleanedData$housing))
loan_clean <- as.data.frame(table(cleanedData$loan))
month_clean <- as.data.frame(table(cleanedData$month))
poutcome_clean <- as.data.frame(table(cleanedData$poutcome))
nr.employed_clean
job_clean
marital_clean
education_clean
housing_clean
loan_clean
month_clean
poutcome_clean
Info Gain Cleaned
IG_cleaned <- sort(InfoGainAttributeEval(Subscribed ~ . , na.action = na.pass , data = cleanedData) , decreasing = TRUE)
barplot(IG_cleaned , las=2)
Ctree 1
formula1 <- Subscribed ~ nr.employed + duration
Tree1 <- ctree(formula = formula1, data = cleanedData)
plot(Tree1)
testTree1 <- predict(Tree1, newdata=cleanedTest)
table(testTree1, cleanedTest$Subscribed)
confMat1 <- table(testTree1,cleanedTest$Subscribed)
accuracy1 <- sum(diag(confMat1))/sum(confMat1)
print(accuracy1)
#Ctree 2
formula2 <- Subscribed ~ nr.employed + duration + pdays
Tree2 <- ctree(formula = formula2, na.action = na.pass, data = cleanedData)
plot(Tree2)
testTree2 <- predict(Tree2, newdata=cleanedTest)
table(testTree2, cleanedTest$Subscribed)
confMat2 <- table(testTree2,cleanedTest$Subscribed)
accuracy2 <- sum(diag(confMat2))/sum(confMat2)
print(accuracy2)
#Ctree 3
formula3 <- Subscribed ~ job + campaign + marital + day_of_week + loan
Tree3 <- ctree(formula = formula3, na.action = na.exclude, data = cleanedData)
plot(Tree3)
testTree3 <- predict(Tree3, newdata=cleanedTest)
table(testTree3, cleanedTest$Subscribed)
confMat3 <- table(testTree3,cleanedTest$Subscribed)
accuracy3 <- sum(diag(confMat3))/sum(confMat3)
print(accuracy3)
#Ctree 4
formula4 <- Subscribed ~ .
Tree4 <- ctree(formula = formula4, na.action = na.omit, data = cleanedData)
plot(Tree4)
testTree4 <- predict(Tree4, newdata = cleanedTest)
table(testTree4, cleanedTest$Subscribed)
confMat4 <- table(testTree4, cleanedTest$Subscribed)
accuracy4 <- sum(diag(confMat4))/sum(confMat4)
print(accuracy4)
