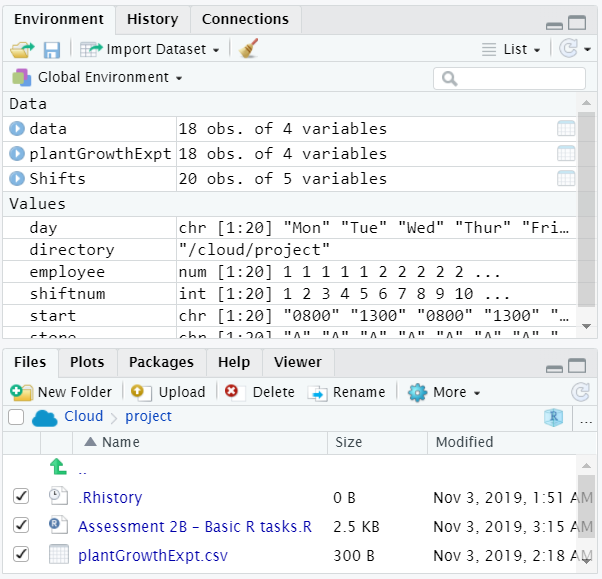
Even though the file exists in the environment and in the working directory, R cannot open the file, it states that there is no such file or directory. Here's a screenshot of the environment and working directory:
And here's the code:
#Q1

#Create a data frame which divides up responsibility for employees to manage a store
#Column 1 is the shift number – this number should be the same as the row number.
#Column 2 is the day as a factor, 1-5 being Monday, Tuesday, … Friday respectively.
#Column 3 is the store location, either A or B.
#Column 4 is the starting time, either 800 or 1300.
#Column 5 is the employee number, 1, 2, 3 or 4.

shiftnum<-1:20
store<-c(rep("A",10), rep("B",10))
day<-rep(c("Mon","Tue","Wed","Thur","Fri"),4)
start<-rep(c("0800","1300"),10)
employee<-c(rep(1,5), rep(2,5), rep(3,5), rep(4,5))
Shifts<-data.frame(Shift.Number=shiftnum,Day=day,Store=store,Starting.Time=start,Employee=employee)

#use logical selection, along with the length() function, to count the number of times that employee 2 works at store B
length(which(Shifts$Employee==2 & Shifts$Store=="B"))
#> [1] 0

#Use logical selection to find where employee 3 is working on Wednesday
Shifts$Store[which(Shifts$Employee==3 & Shifts$Day=="Wed")]
#> [1] B
#> Levels: A B


#Q2

#Compute the log to base 10 of 50
log10(50)
#> [1] 1.69897

#Compute the sqrt of 20
sqrt(20)
#> [1] 4.472136


#Q3

#Import the data plantGrowthExpt.csv file to Rstudio
directory <- ("/cloud/project")
data<- read.csv("plantGrowthExpt.csv")
#> Warning in file(file, "rt"): cannot open file 'plantGrowthExpt.csv': No
#> such file or directory
#> Error in file(file, "rt"): cannot open the connection

#Check that the data imported correctly using the View command
View(plantGrowthExpt)
#> Error in as.data.frame(x): object 'plantGrowthExpt' not found

#Produce a histogram of height.cm
hist(data$height.cm)
#> Error in data$height.cm: object of type 'closure' is not subsettable

#Produce a Q-Q plot of height.cm
hist(data$height.cm)
#> Error in data$height.cm: object of type 'closure' is not subsettable

#Produce a boxplot of height.cm
boxplot(data$height.cm,ylab="height (cm)")
#> Error in data$height.cm: object of type 'closure' is not subsettable

#Produce side-by-side boxplots to compare how the distribution of height.cm differs between varieties A and B
boxplot(data$height.cm~data$variety,ylab="height (cm)")
#> Error in data$height.cm: object of type 'closure' is not subsettable

#Produce a scatterplot with height.cm on the y-axis and biomass.gm on the x-axis. #Change plot symbol to pch=16 (filled circle) and colour code purple
# X axis label = xlab, Y axis label = ylab

plot(data$biomass.gm, data$height.cm,
     pch=16, col="purple",
     xlab="biomass (gm)",ylab="height (cm)"
)
#> Error in data$biomass.gm: object of type 'closure' is not subsettable

#Colour code the points to distinguish each variety
#New colour code orange
points(data$biomass.gm[data$variety=="B"],
       data$height.cm[data$variety=="B"],
       pch=16, col="orange",
       xlab="biomass (gm)", ylab="height (cm)",
)
#> Error in data$biomass.gm: object of type 'closure' is not subsettable

plot(data$biomass.gm,data$height.cm,xlab="biomass (gm)",ylab="height (cm)")
#> Error in data$biomass.gm: object of type 'closure' is not subsettable


#Compute the minimum, 1st quartile, median, mean, 3rd quartile and maximum for height.cm and biomass.cm - variety A

summary(data[data$variety=="A",])
#> Error in data$variety: object of type 'closure' is not subsettable


#Compute the minimum, 1st quartile, median, mean, 3rd quartile and maximum for height.cm and biomass.cm - variety B

summary(data[data$variety=="B",])
#> Error in data$variety: object of type 'closure' is not subsettable
Looking forward to your feedback.