lucyb
January 24, 2019, 3:17pm
1
Here is my data:
Type
Respiratory Rate
C
20
C
21
M
20
M
18
N
17
N
16
C
19
C
17
M
17
M
19
N
23
N
18
C
16
C
19
M
20
M
21
N
20
N
20
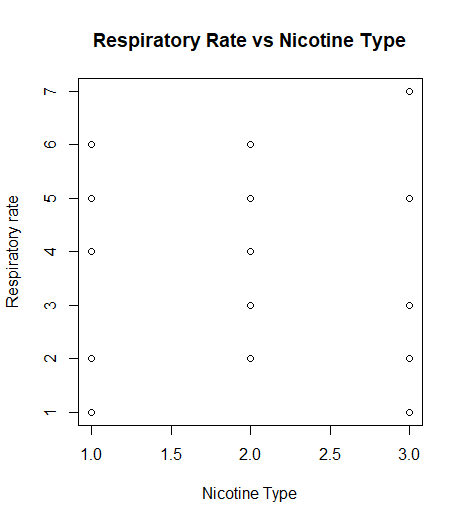
I am trying to just do a simple scatter plot with a trend line.
plot.default(Type,Respiratory.Rate,main="Respiratory Rate vs Nicotine Type",xlab="Nicotine Type",ylab="Respiratory rate")
I'm trying to get the three different groups (C,M,N) different colored dots. HELP
Hi @lucyb
Could you please turn this into a self-contained reprex (short for repr oducible ex ample)? It will help us help you if we can be sure we're all working with/looking at the same stuff.
install.packages("reprex")
If you've never heard of a reprex before, you might want to start by reading the tidyverse.org help page . The reprex dos and don'ts are also useful.
What to do if you run into clipboard problems
If you run into problems with access to your clipboard, you can specify an outfile for the reprex, and then copy and paste the contents into the forum.
reprex::reprex(input = "fruits_stringdist.R", outfile = "fruits_stringdist.md")
For pointers specific to the community site, check out the reprex FAQ , linked to below.
1 Like
iugax
January 24, 2019, 3:26pm
3
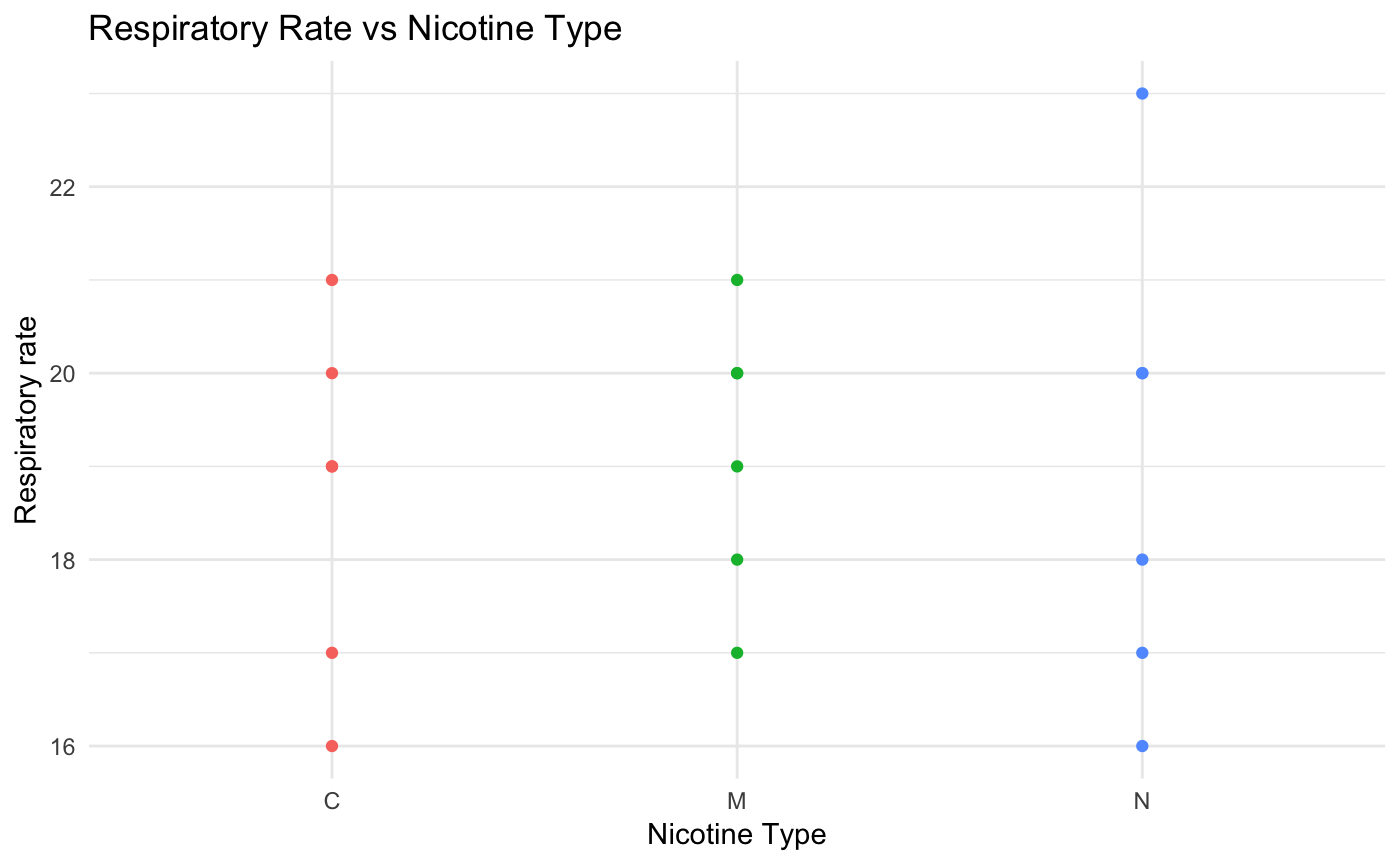
Hi Lucy ! Are you looking for something like?
library(tidyverse)

data <- tibble::tribble(
    ~Type, ~Respiratory.Rate,
      "C",                20,
      "C",                21,
      "M",                20,
      "M",                18,
      "N",                17,
      "N",                16,
      "C",                19,
      "C",                17,
      "M",                17,
      "M",                19,
      "N",                23,
      "N",                18,
      "C",                16,
      "C",                19,
      "M",                20,
      "M",                21,
      "N",                20,
      "N",                20
    )

data %>%
    ggplot(aes(x=Type, y=Respiratory.Rate, color=Type)) +
    geom_point() +
    labs(x='Nicotine Type', y='Respiratory rate', title='Respiratory Rate vs Nicotine Type') +
    theme_minimal() +
    theme(legend.position='none')
2 Likes
lucyb
January 24, 2019, 3:30pm
4
wow helped me no much thank you!!!!
1 Like
system
January 31, 2019, 3:30pm
5
This topic was automatically closed 7 days after the last reply. New replies are no longer allowed.