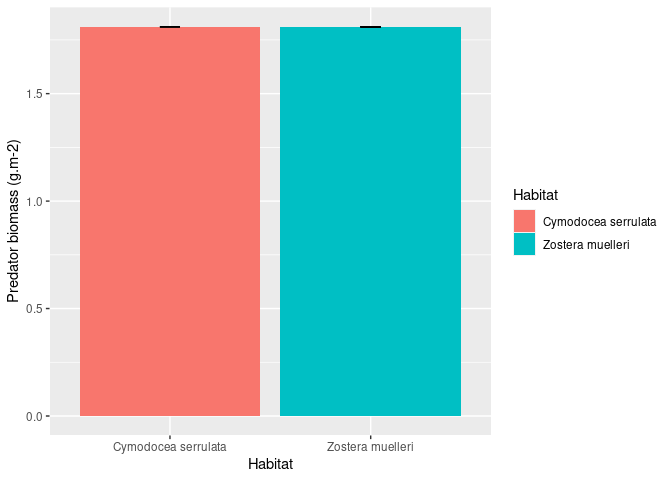
The se variable you reference in your code is not present in your sample data, but if I ommit that this is what I get
library(ggplot2)

# Sample data on a copy/paste friendly format
data_sum <- data.frame(
    stringsAsFactors = FALSE,
    Habitat = c("Cymodocea serrulata","Cymodocea serrulata",
                "Zostera muelleri","Zostera muelleri",
                "Zostera muelleri","Zostera muelleri","Zostera muelleri",
                "Zostera muelleri"),
    Biomass = c(1.8110906572861,1.8110906572861,1.8110906572861,
                1.8110906572861,1.8110906572861,1.8110906572861,
                1.8110906572861,1.8110906572861))

ggplot(data_sum, aes(x = Habitat, y = Biomass, fill = Habitat)) +
    geom_bar(position = position_dodge(.9), stat = "identity") +
    geom_errorbar(aes(ymin = Biomass, ymax = Biomass), width = .1) +
    xlab("Habitat") +
    ylab("Predator biomass (g.m-2)")
Created on 2021-03-16 by the reprex package (v1.0.0.9002)
As you can see I can't reproduce your issue with the data you are providing, can you try again to make a reproducible example that actually shows the problem?