Is it possible to plot SHAP values for a single observation in R like you can in python?
This post make a nice plot for single observations:
https://www.kaggle.com/dansbecker/shap-values
The force_plot in python seems to vary quite a bit from the R version. Can I recreate such a plot with the SHAPforxgboost library, or does anyone have ideas on what I can do with ggplot2?
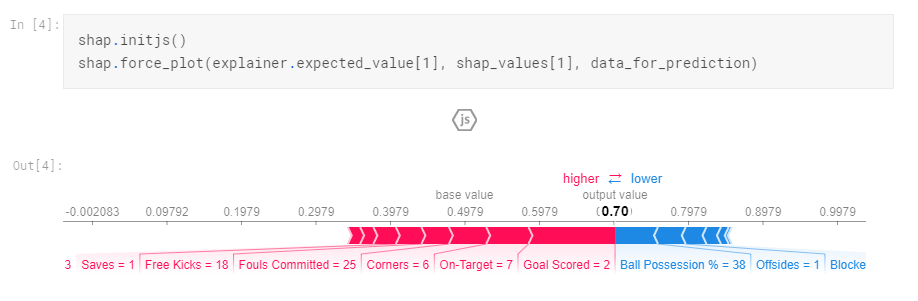
shap.initjs()
shap.force_plot(explainer.expected_value[1], shap_values[1], data_for_prediction)
Here is the plot from Python.
Thank you,
- Nicolai