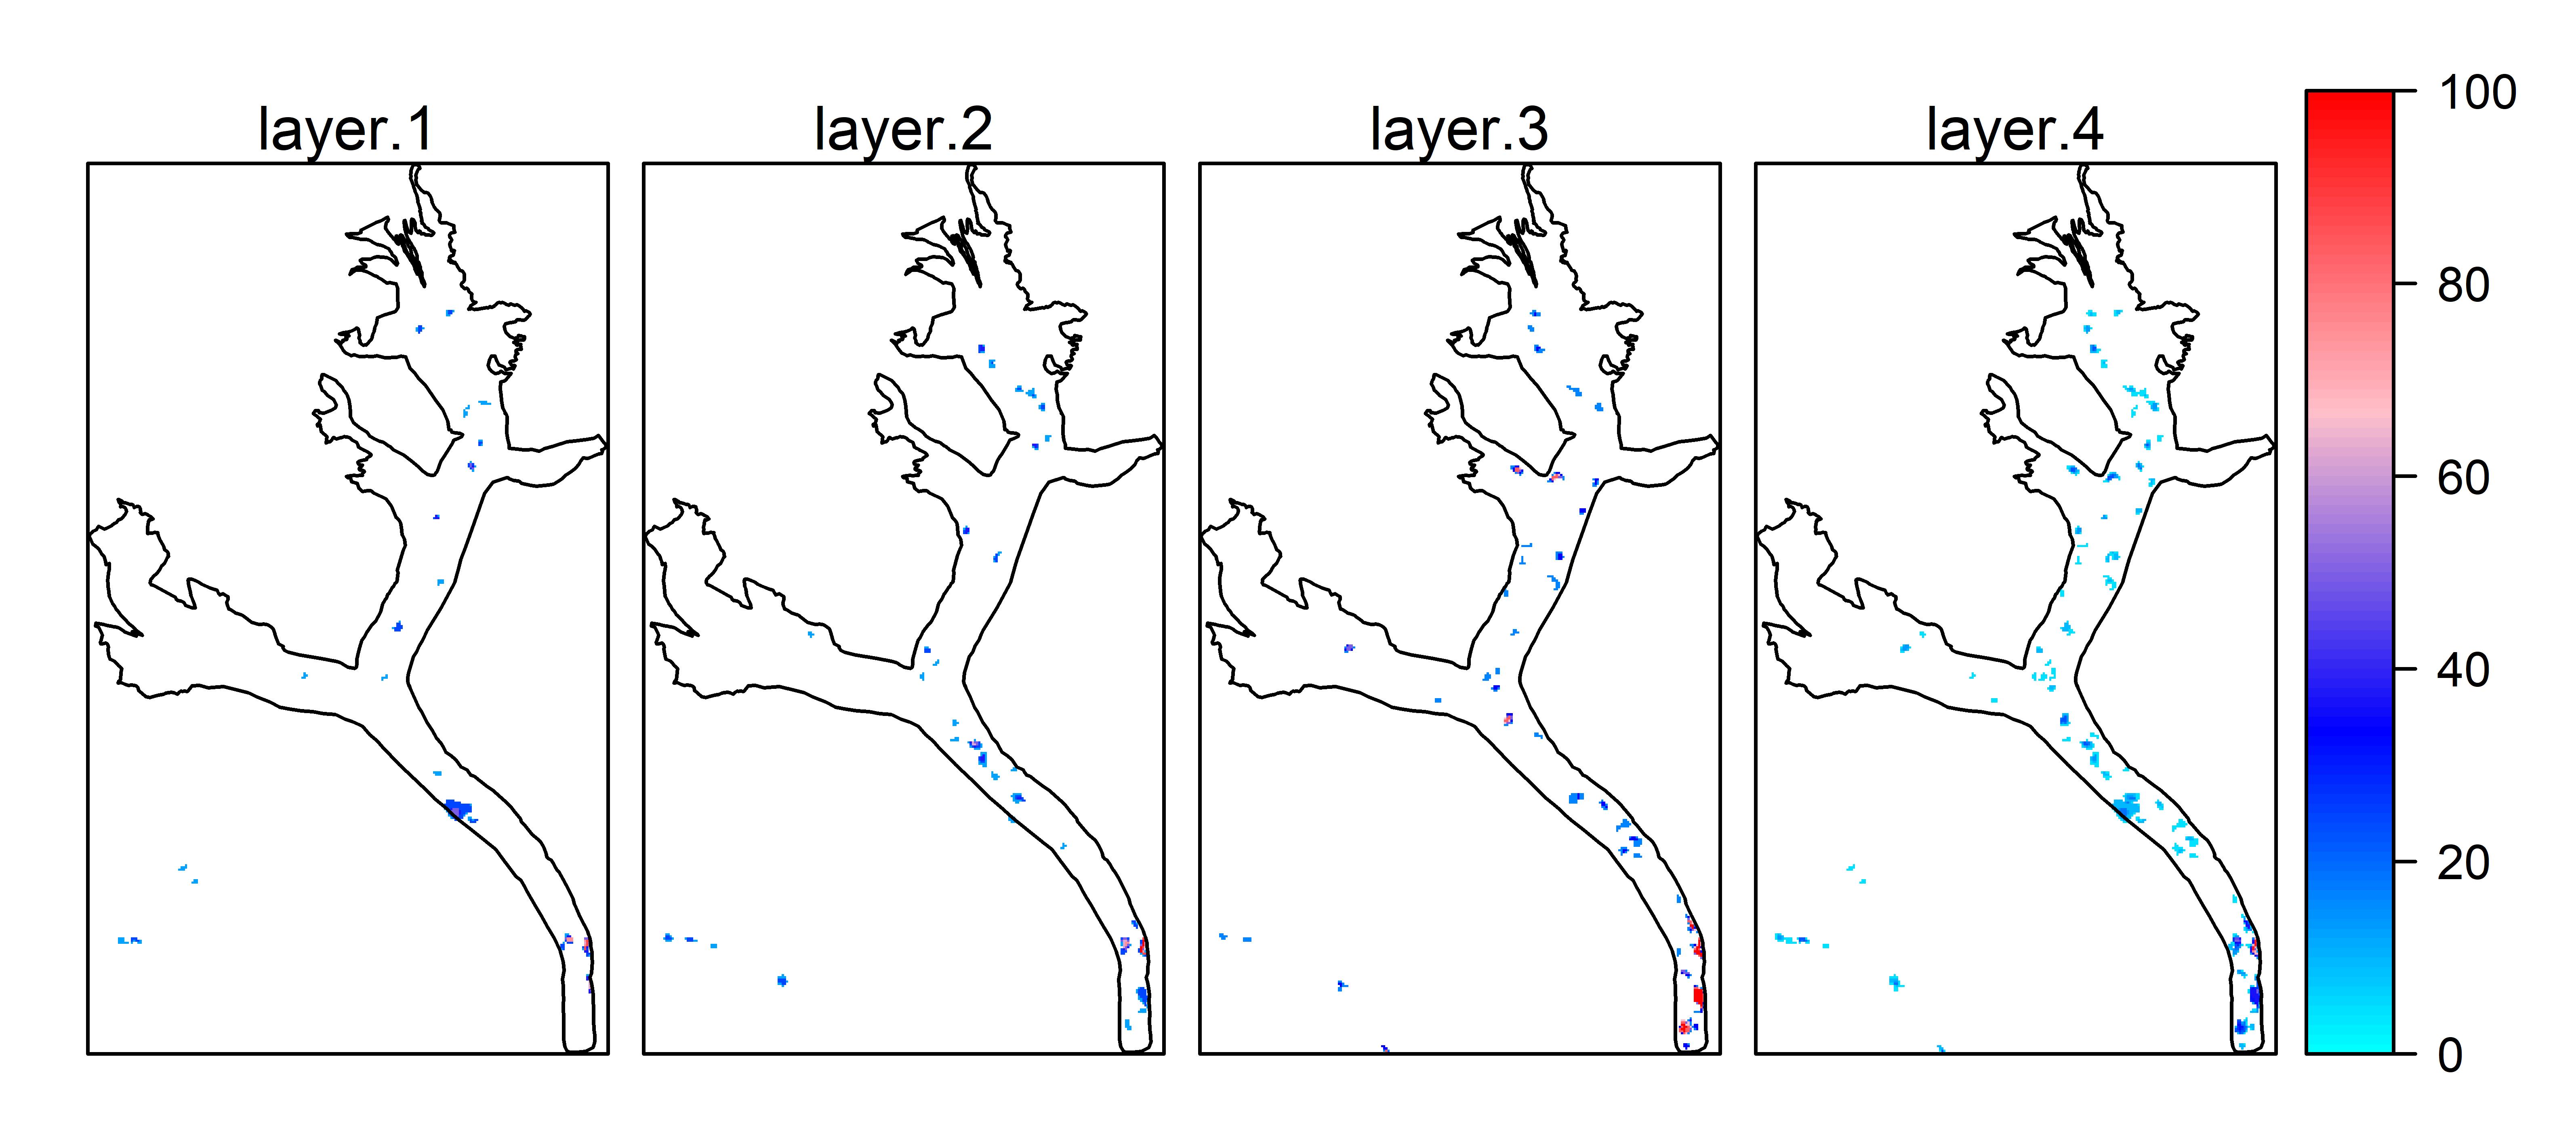
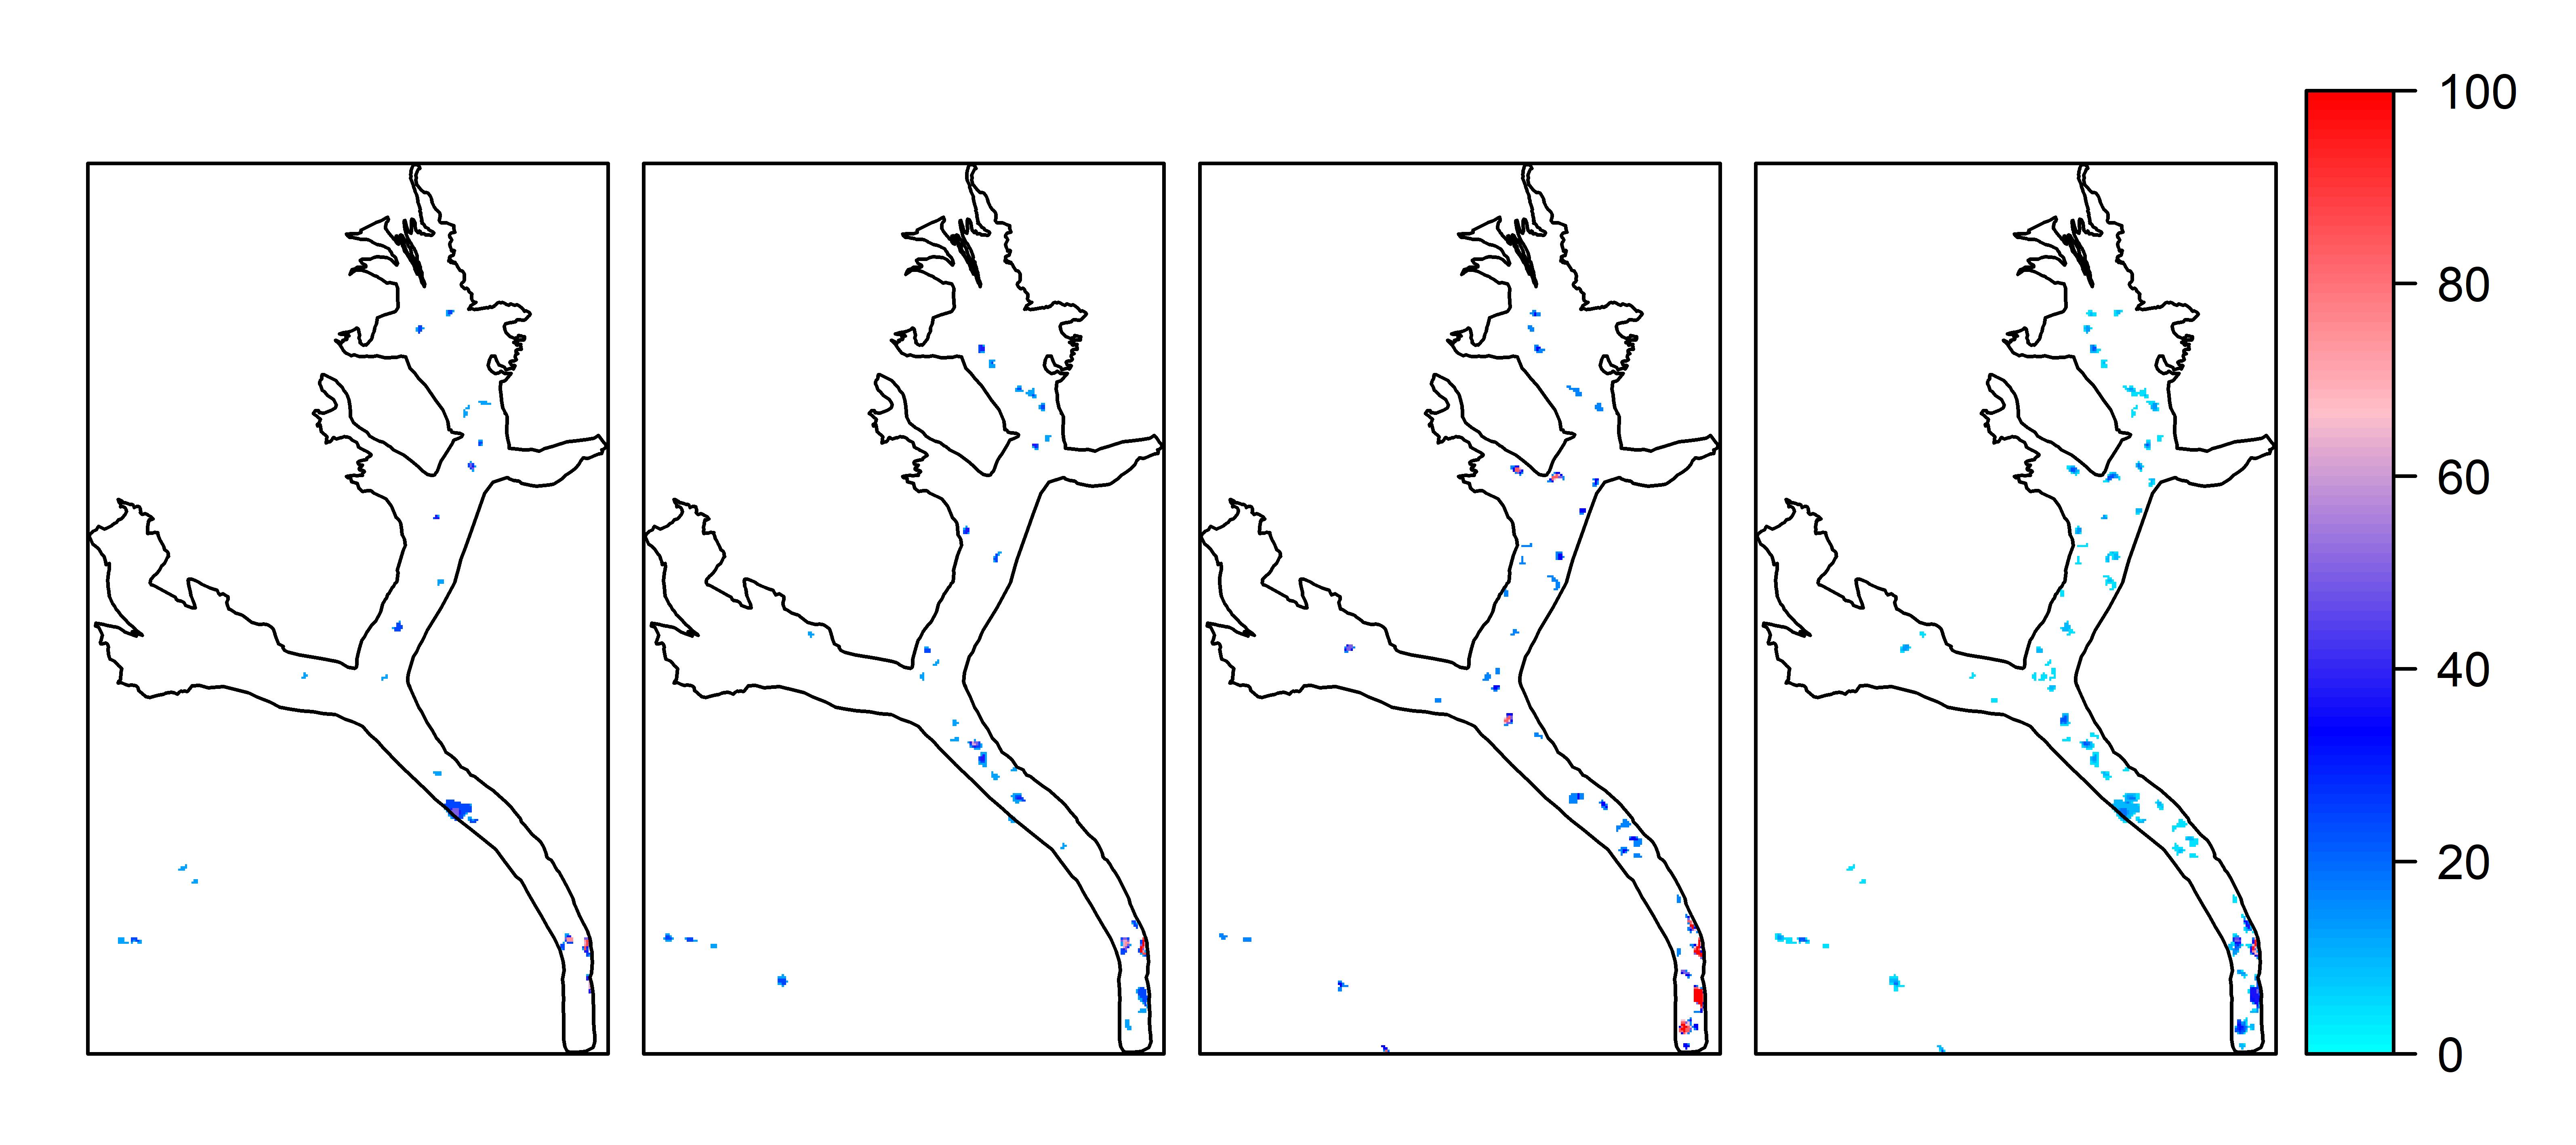
I read the 22 raster files and made the stack of all and then cropped them using shapefile (shp_Bhote). I divided the 22 rasters into four groups according to different time raster. I estimated the frequency of the values in raster for each group and made a four stack from them. And then I plotted the four different raster stack using level plot and layout function. However, the title of each plot on the graph comes automatically like layer.1, layer.2, layer.3, and layer.4. I want to remove this title from my plot, however, I can not figure out the issue. Help will be highly appreciated. I am sorry for the bad question.
Here is the code that I used for the plot. List of tif files
Can you please turn this into a REPRoducible EXample? From the way you have posted your code, it's not clear to me which packages you're using, or what is the dataset leading to frequency_Bhote_a etc.
In case you don't know how to make a reprex, here's a great link:
I tried to use the function names.attr = NULL but it shows the error as follows.
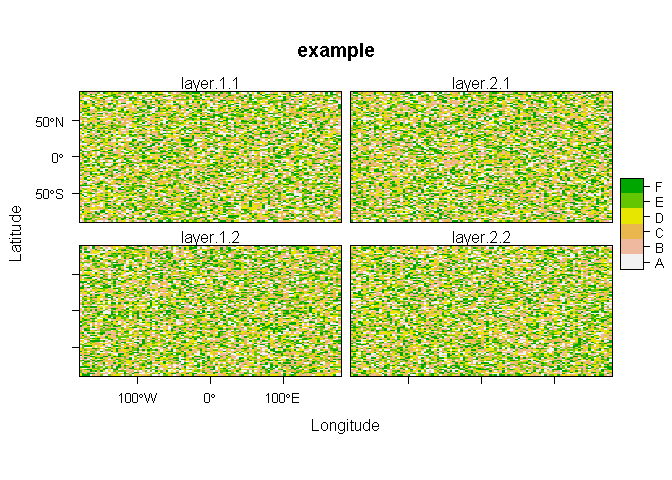
levelplot(Bhote_stack,colorkey = TRUE, layout=c(4, 1),scales=list(x=list(draw=FALSE),y=list(draw=FALSE)), at=breaks, col.regions=cols, main = "Example", names.attr= NULL), layer(sp.polygons(shp_Bhote))
Error in .local(x, data, ...) :
Length of names.attr should match number of layers.
Similarly, I tried the following codes also shows the error
levelplot(Bhote_stack[[1:4]],colorkey = TRUE, layout=c(4, 1),scales=list(x=list(draw=FALSE),y=list(draw=FALSE)), at=breaks, col.regions=cols, main = "Example", names.attr= 1:4), layer(sp.polygons(shp_Bhote))
Error in valid.data(rep(units, length.out = length(x)), data) :
no string supplied for 'strwidth/height' unit
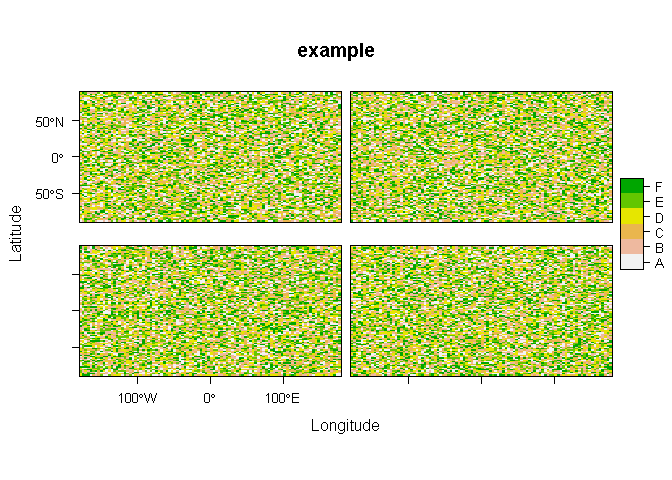
Yes, this helped me to remove the title of the subplot. Thank you very much for your effort. I am wondering about the sizes of the subplot. I expected the increase in the size of subplot by removing the title. Space still seems unused.