Thanks for the reply!
Could you explain what limits= c(0.001, 3) stands for?
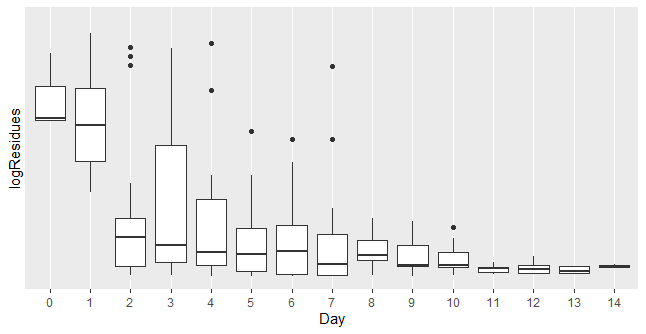
When using your code the boxplots on Day 0 and 1 are not visible.
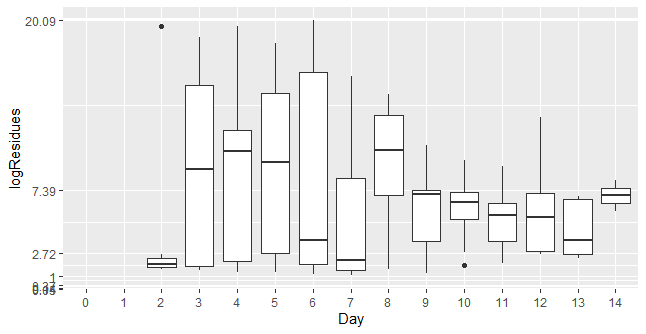
They do appear when I change the max limit to 5 , however I have to remove the breaks in order to make the code work, which means my y axis disappears.
ggplot(data, aes(x=Day, y=logResidues)) +
  geom_boxplot()+
  scale_y_continuous(trans = "exp",limits = c(0,5), labels= rexp2, breaks=NULL)
Do you know how I could get the breaks and y axis labels back?
Many thanks for your help!