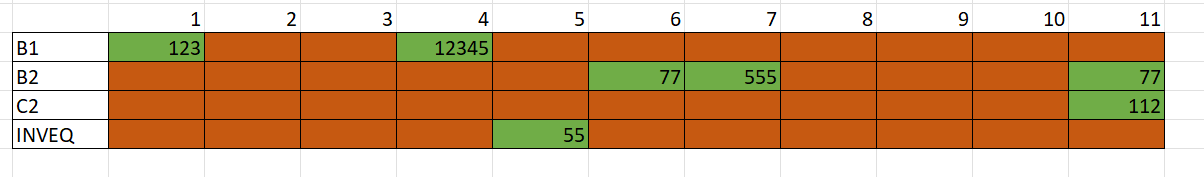
Here's another possibility that builds on my previous comment and @mduvekot's suggestion (with full reprex at the bottom of post):
EX <- data.frame(LOTE=c('B1','B1','B1','B2','B2','C2','C2','INVEQ'),
                 CAMA=c(1,2,4,'6/11',7,6,11,5),
                 ACC=c(123,NA,12345,77,555,NA,112,55))
library(tidyverse)
# transform EX to longer table wth numeric values for CAMA and LOTE
EX.num <-
EX |>
# separate '6/11' into the numbers 6 and 7
separate_longer_delim(CAMA, '/') |>
# convert LOTE to factor, ordered by decreasing row number
mutate(LOTE = fct_reorder(LOTE, row_number(), .desc = T)) |>
# convert CAMA and LOTE values to numbers for easier plotting
mutate(CAMA = CAMA |> as.numeric()) |>
mutate(LOTE.num = LOTE |> as.numeric()) |>
# remove rows that contain an NA
drop_na()
EX.num |>
drop_na() |>
ggplot() +
geom_tile(
aes(CAMA, LOTE.num, width = 1, height = 1),
fill = 'forestgreen',
color = 'black'
) +
geom_text(aes(CAMA, LOTE.num, label = ACC)) +
scale_y_continuous(
name = 'LOTE',
limits = c(0.5, 4.5),
breaks = 1:4,
minor_breaks = 0.5:4.5,
labels = EX.num |> pull(LOTE) |> levels(),
expand = expansion()
) +
scale_x_continuous(
breaks = EX.num |> pull(CAMA) %>% {min(.):max(.)},
expand = expansion()
) +
theme(
panel.background = element_rect(fill = 'chocolate'),
panel.grid.major = element_blank(),
panel.grid.minor = element_line(color = 'black')
)

Created on 2024-05-22 with reprex v2.0.2
Full reprex
EX <- data.frame(LOTE=c('B1','B1','B1','B2','B2','C2','C2','INVEQ'),
                 CAMA=c(1,2,4,'6/11',7,6,11,5),
                 ACC=c(123,NA,12345,77,555,NA,112,55))

library(tidyverse)

# transform EX to longer table wth numeric values for CAMA and LOTE
EX.num <-
  EX |>
  # separate '6/11' into the numbers 6 and 7
  separate_longer_delim(CAMA, '/') |>
  # convert LOTE to factor, ordered by decreasing row number
  mutate(LOTE = fct_reorder(LOTE, row_number(), .desc = T)) |>
  # convert CAMA and LOTE values to numbers for easier plotting
  mutate(CAMA = CAMA |> as.numeric()) |>
  mutate(LOTE.num = LOTE |> as.numeric()) |>
  # remove rows that contain an NA
  drop_na()
EX.num |>
  drop_na() |>
  ggplot() +
  geom_tile(
    aes(CAMA, LOTE.num, width = 1, height = 1),
    fill = 'forestgreen',
    color = 'black'
    ) +
  geom_text(aes(CAMA, LOTE.num, label = ACC)) +
  scale_y_continuous(
    name = 'LOTE',
    limits = c(0.5, 4.5),
    breaks = 1:4,
    minor_breaks = 0.5:4.5,
    labels = EX.num |> pull(LOTE) |> levels(),
    expand = expansion()
  ) +
  scale_x_continuous(
    breaks = EX.num |> pull(CAMA) %>% {min(.):max(.)},
    expand = expansion()
) +
  theme(
    panel.background = element_rect(fill = 'chocolate'),
    panel.grid.major = element_blank(),
    panel.grid.minor = element_line(color = 'black')
  )
Created on 2024-05-22 with reprex v2.0.2