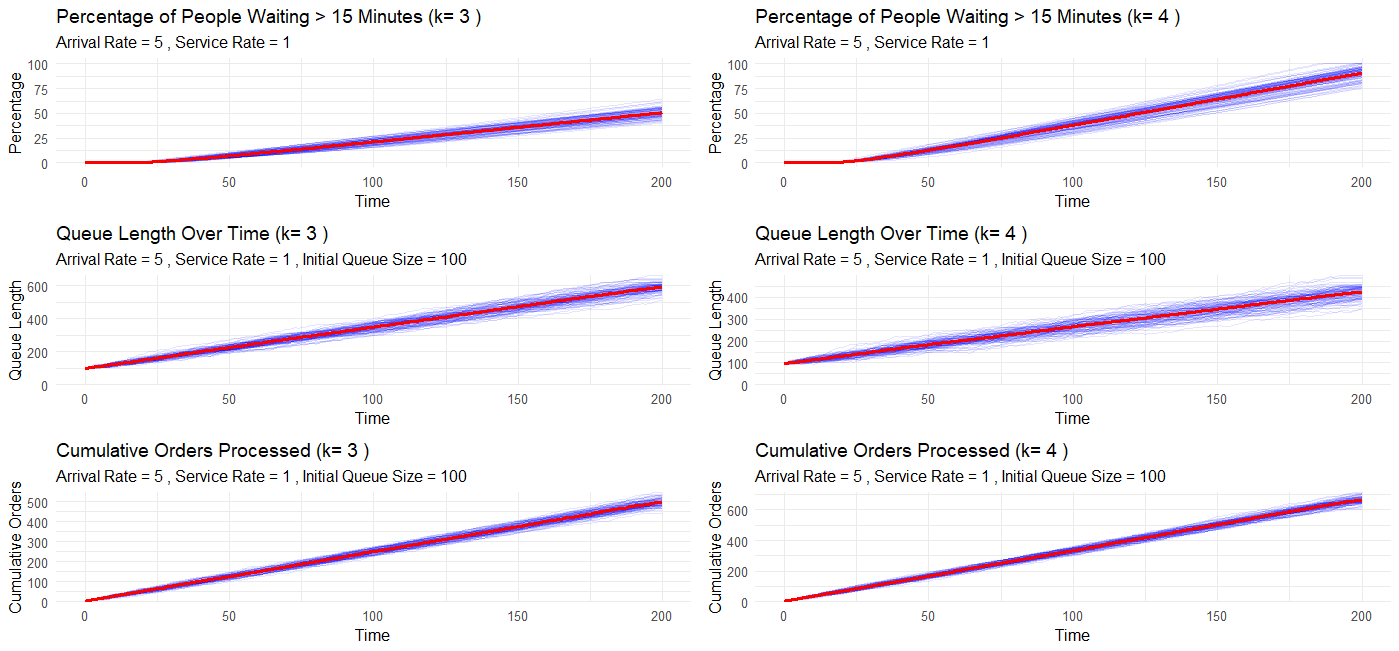
I am trying to simulate a queue with the following parameters:
lambda <- 5
mu <- 1
sim_time <- 200
k_minutes <- 15
num_simulations <- 100
initial_queue_size <- 100
time_step <- 1

lambda <- 5  # Arrival rate
mu <- 1      # Service rate
sim_time <- 200  # Simulation time
k_minutes <- 15  # Threshold for waiting time
num_simulations <- 100  # Number of simulations to run
initial_queue_size <- 100  # Initial queue size
time_step <- 1  # Time step for discretization
I simulated this code in R for 3 Servers vs 4 Servers:
  library(dplyr)
library(ggplot2)
library(tidyr)
library(purrr)
library(gridExtra)

lambda <- 5
mu <- 1
sim_time <- 200
k_minutes <- 15
num_simulations <- 100
initial_queue_size <- 100
time_step <- 1
k_values <- c(3, 4)

run_simulation <- function(seed, k) {
    set.seed(seed)

    events <- data.frame(
        time = c(0, cumsum(rexp(ceiling(sim_time * lambda), rate = lambda))),
        type = "arrival"
    )
    events <- events[events$time <= sim_time, ]

    queue <- numeric(initial_queue_size)  # Initialize queue with initial_queue_size
    servers <- numeric(k)
    processed <- 0
    waiting_times <- numeric()

    results <- data.frame(
        time = seq(0, sim_time, by = time_step),
        queue_length = initial_queue_size,
        processed_orders = 0,
        waiting_longer = 0,
        total_arrivals = initial_queue_size
    )

    event_index <- 1
    for (i in 1:nrow(results)) {
        current_time <- results$time[i]

        # Process events up to current time
        while (event_index <= nrow(events) && events$time[event_index] <= current_time) {
            event_time <- events$time[event_index]

            # Process completed services
            finished <- servers <= event_time
            if (any(finished)) {
                processed <- processed + sum(finished)
                servers[finished] <- 0
            }

            # Process new arrival
            results$total_arrivals[i] <- results$total_arrivals[i] + 1
            if (any(servers == 0)) {
                free_server <- which(servers == 0)[1]
                servers[free_server] <- event_time + rexp(1, mu)
                waiting_times <- c(waiting_times, 0)
            } else {
                queue <- c(queue, event_time)
            }

            # Update queue
            while (length(queue) > 0 && any(servers == 0)) {
                free_server <- which(servers == 0)[1]
                wait_time <- event_time - queue[1]
                waiting_times <- c(waiting_times, wait_time)
                servers[free_server] <- event_time + rexp(1, mu)
                queue <- queue[-1]
            }

            event_index <- event_index + 1
        }

        results$queue_length[i] <- length(queue)
        results$processed_orders[i] <- processed
        results$waiting_longer[i] <- sum(waiting_times > k_minutes)
    }

    results
}

run_simulations <- function(k_values) {
    map(k_values, function(k) {
        map(1:num_simulations, ~run_simulation(., k)) %>%
            set_names(paste0("sim_", 1:num_simulations))
    }) %>% set_names(paste0("k", k_values))
}

simulations <- run_simulations(k_values)

process_results <- function(simulations) {
    map_dfr(names(simulations), function(k_name) {
        k <- as.integer(gsub("k", "", k_name))
        bind_rows(simulations[[k_name]], .id = "simulation") %>%
            mutate(k = k, simulation = as.integer(gsub("sim_", "", simulation))) %>%
            group_by(simulation, k) %>%
            mutate(
                cumulative_waiting_longer = cumsum(waiting_longer),
                cumulative_total_arrivals = cumsum(total_arrivals),
                waiting_percentage = pmin(100, pmax(0, (cumulative_waiting_longer / cumulative_total_arrivals) * 100))
            ) %>%
            ungroup()
    })
}

all_results <- process_results(simulations)

plot_waiting_percentage <- function(data, k) {
    ggplot(data %>% filter(k == !!k), aes(x = time, y = waiting_percentage, group = simulation)) +
        geom_line(alpha = 0.1, color = "blue") +
        stat_summary(fun = mean, geom = "line", aes(group = 1), color = "red", size = 1) +
        labs(title = paste("Percentage of People Waiting >", k_minutes, "Minutes (k=", k, ")"),
             subtitle = paste("Arrival Rate =", lambda, ", Service Rate =", mu),
             x = "Time", y = "Percentage") +
        theme_minimal() +
        ylim(0, 100)
}

plot_queue_length <- function(data, k) {
    ggplot(data %>% filter(k == !!k), aes(x = time, y = queue_length, group = simulation)) +
        geom_line(alpha = 0.1, color = "blue") +
        stat_summary(fun = mean, geom = "line", aes(group = 1), color = "red", size = 1) +
        labs(title = paste("Queue Length Over Time (k=", k, ")"),
             subtitle = paste("Arrival Rate =", lambda, ", Service Rate =", mu, ", Initial Queue Size =", initial_queue_size),
             x = "Time", y = "Queue Length") +
        theme_minimal() +
        scale_y_continuous(expand = c(0, 0), limits = c(0, NA))  # Start y-axis from 0
}

plot_cumulative_orders <- function(data, k) {
    ggplot(data %>% filter(k == !!k), aes(x = time, y = processed_orders, group = simulation)) +
        geom_line(alpha = 0.1, color = "blue") +
        stat_summary(fun = mean, geom = "line", aes(group = 1), color = "red", size = 1) +
        labs(title = paste("Cumulative Orders Processed (k=", k, ")"),
             subtitle = paste("Arrival Rate =", lambda, ", Service Rate =", mu, ", Initial Queue Size =", initial_queue_size),
             x = "Time", y = "Cumulative Orders") +
        theme_minimal() +
        scale_y_continuous(expand = c(0, 0), limits = c(0, NA))
}

plots <- map(k_values, function(k) {
    list(
        waiting_percentage = plot_waiting_percentage(all_results, k),
        queue_length = plot_queue_length(all_results, k),
        cumulative_orders = plot_cumulative_orders(all_results, k)
    )
})

do.call(grid.arrange, c(unlist(plots, recursive = FALSE), ncol = 2))
Based on these results, we can see that on average, the same queue with 4 servers outperforms the 3 server queue for cumulative orders processed and queue length - but somehow the percent of customers waiting longer than 15 minutes is better (i.e. increases slower) for 3 servers than 4 servers? I think this might be a problem with the way my function is calculating percentages
Can someone please help me review and find where the mistake is?
