I have some questions about doing data analysis for calculating (Mean rank) of severity.
My data consists of (Categorical data) with numbers that range from (0-5) on severity of a pathogen.
I was wondering what would be good ways to interpret the data.
In the past I have used the (rankFD) package but I have no idea how to interpret those results.
I usually use a standard two-way anova model with (RR) standing for disease severity rating (0-5) on plants with (Treatment) factor, and (Rep) factor.
RRpathogenicitydata<- read_excel("severity data", sheet=11)
RRpathogenicitydata$Trt<-factor(RRpathogenicitydata$Trt)
RRpathogenicitydata$Rep<-factor(RRpathogenicitydata$Rep)
RRpathogenicitydata$Trial<-factor(RRpathogenicitydata$Rep)
library(rankFD)
FDlentil= rankFD(RR~Trt, data= RRpathogenicitydata, CI.method="Normal",
effect= "unweighted", hypothesis= "H0F")
print(FDlentil)
plot(FDlentil)
Does anyone know how to interpret these results, or other packages and ways to calculate a mean severity rating with categorical data!
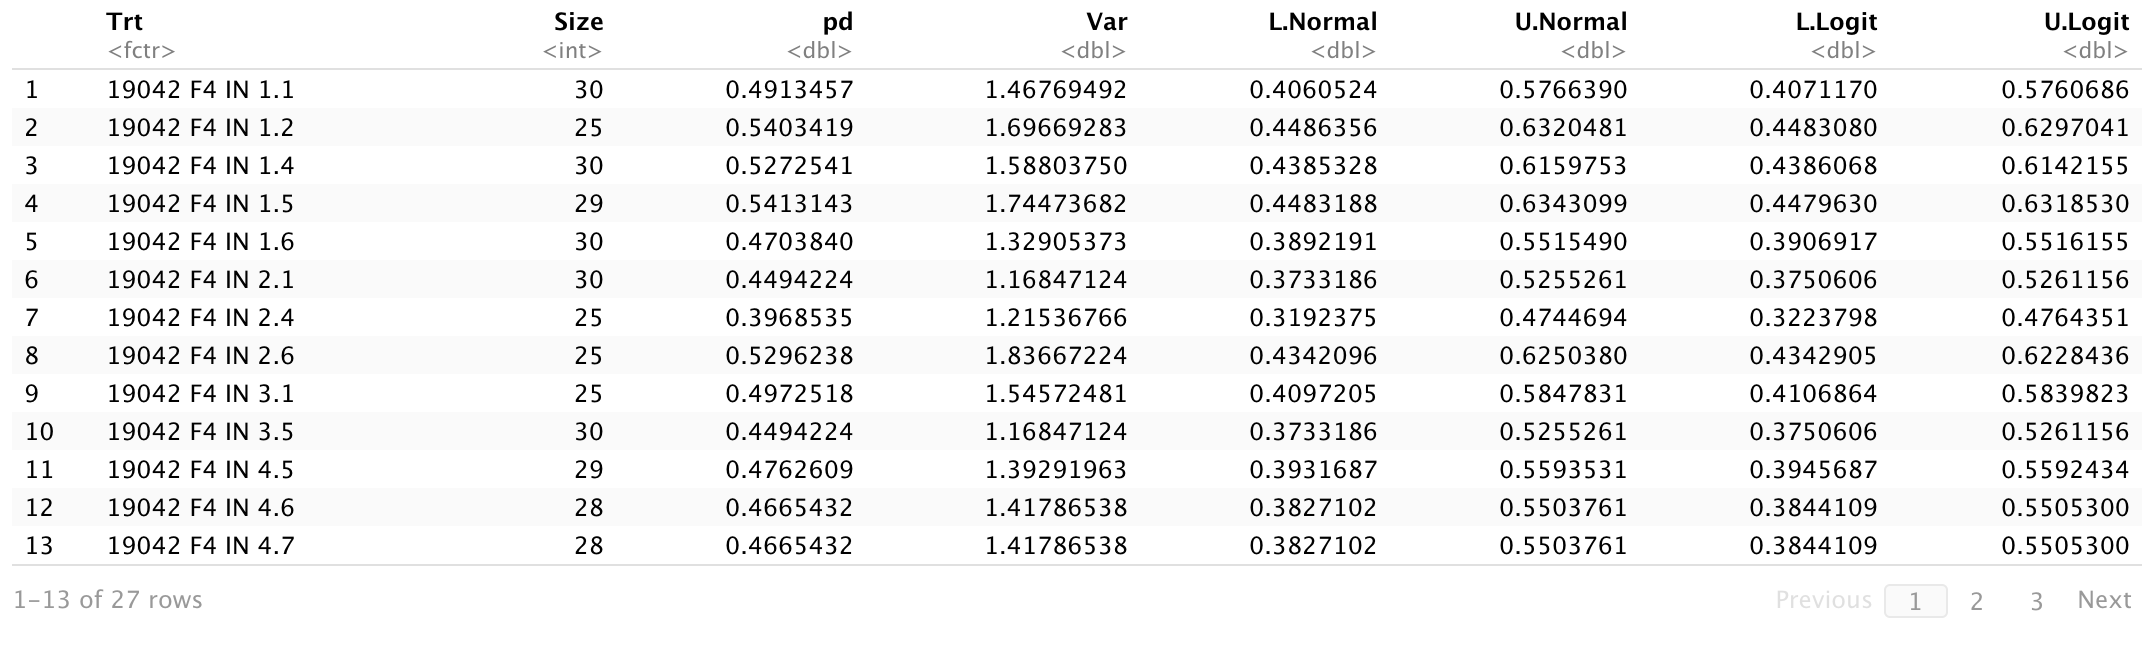
This is the output for the print(FDlentil) function..Descriptive:
Wald-Type Statistic (WTS):
Statistic df p-Value
Trt 518.9195 26 0
ANOVA-Type Statistic (ATS):
Statistic df1 df2 p-Value
Trt 4.090247 21.2114 462.5699 6.0551e-09
Kruskal-Wallis Test:
And I have attached the other results from the plot( ) function.
There has to be other packages, and ways to conduct a statistical analysis for a (RCBD) design with ratings (0-5) I am open to other packages and models. And ways to graph a mean (ranking) rating. Also what assumptions would need to be met for such data?
I do not have much experience with a categorical response variable.