Calculate the change for each patient with a given ID

Hello Everyone,

I need help with a project I am working on. I created a new data from the Iris data which is similar to what I am working on.,

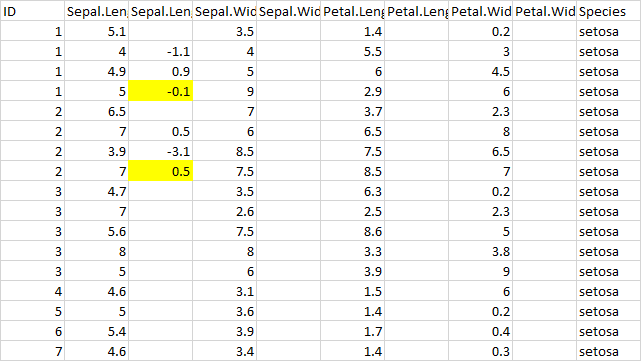
For each patient ID, I want to calculate the change that has occurred. For example, for Sepal Length Change(ie L.Change), I have the value to be (5.0-4.9-4.0-5.1=-9). I will then put this value (-9) on the last row for that patient ID number (thus 1 in this case) and then do same for the rest of the patients.

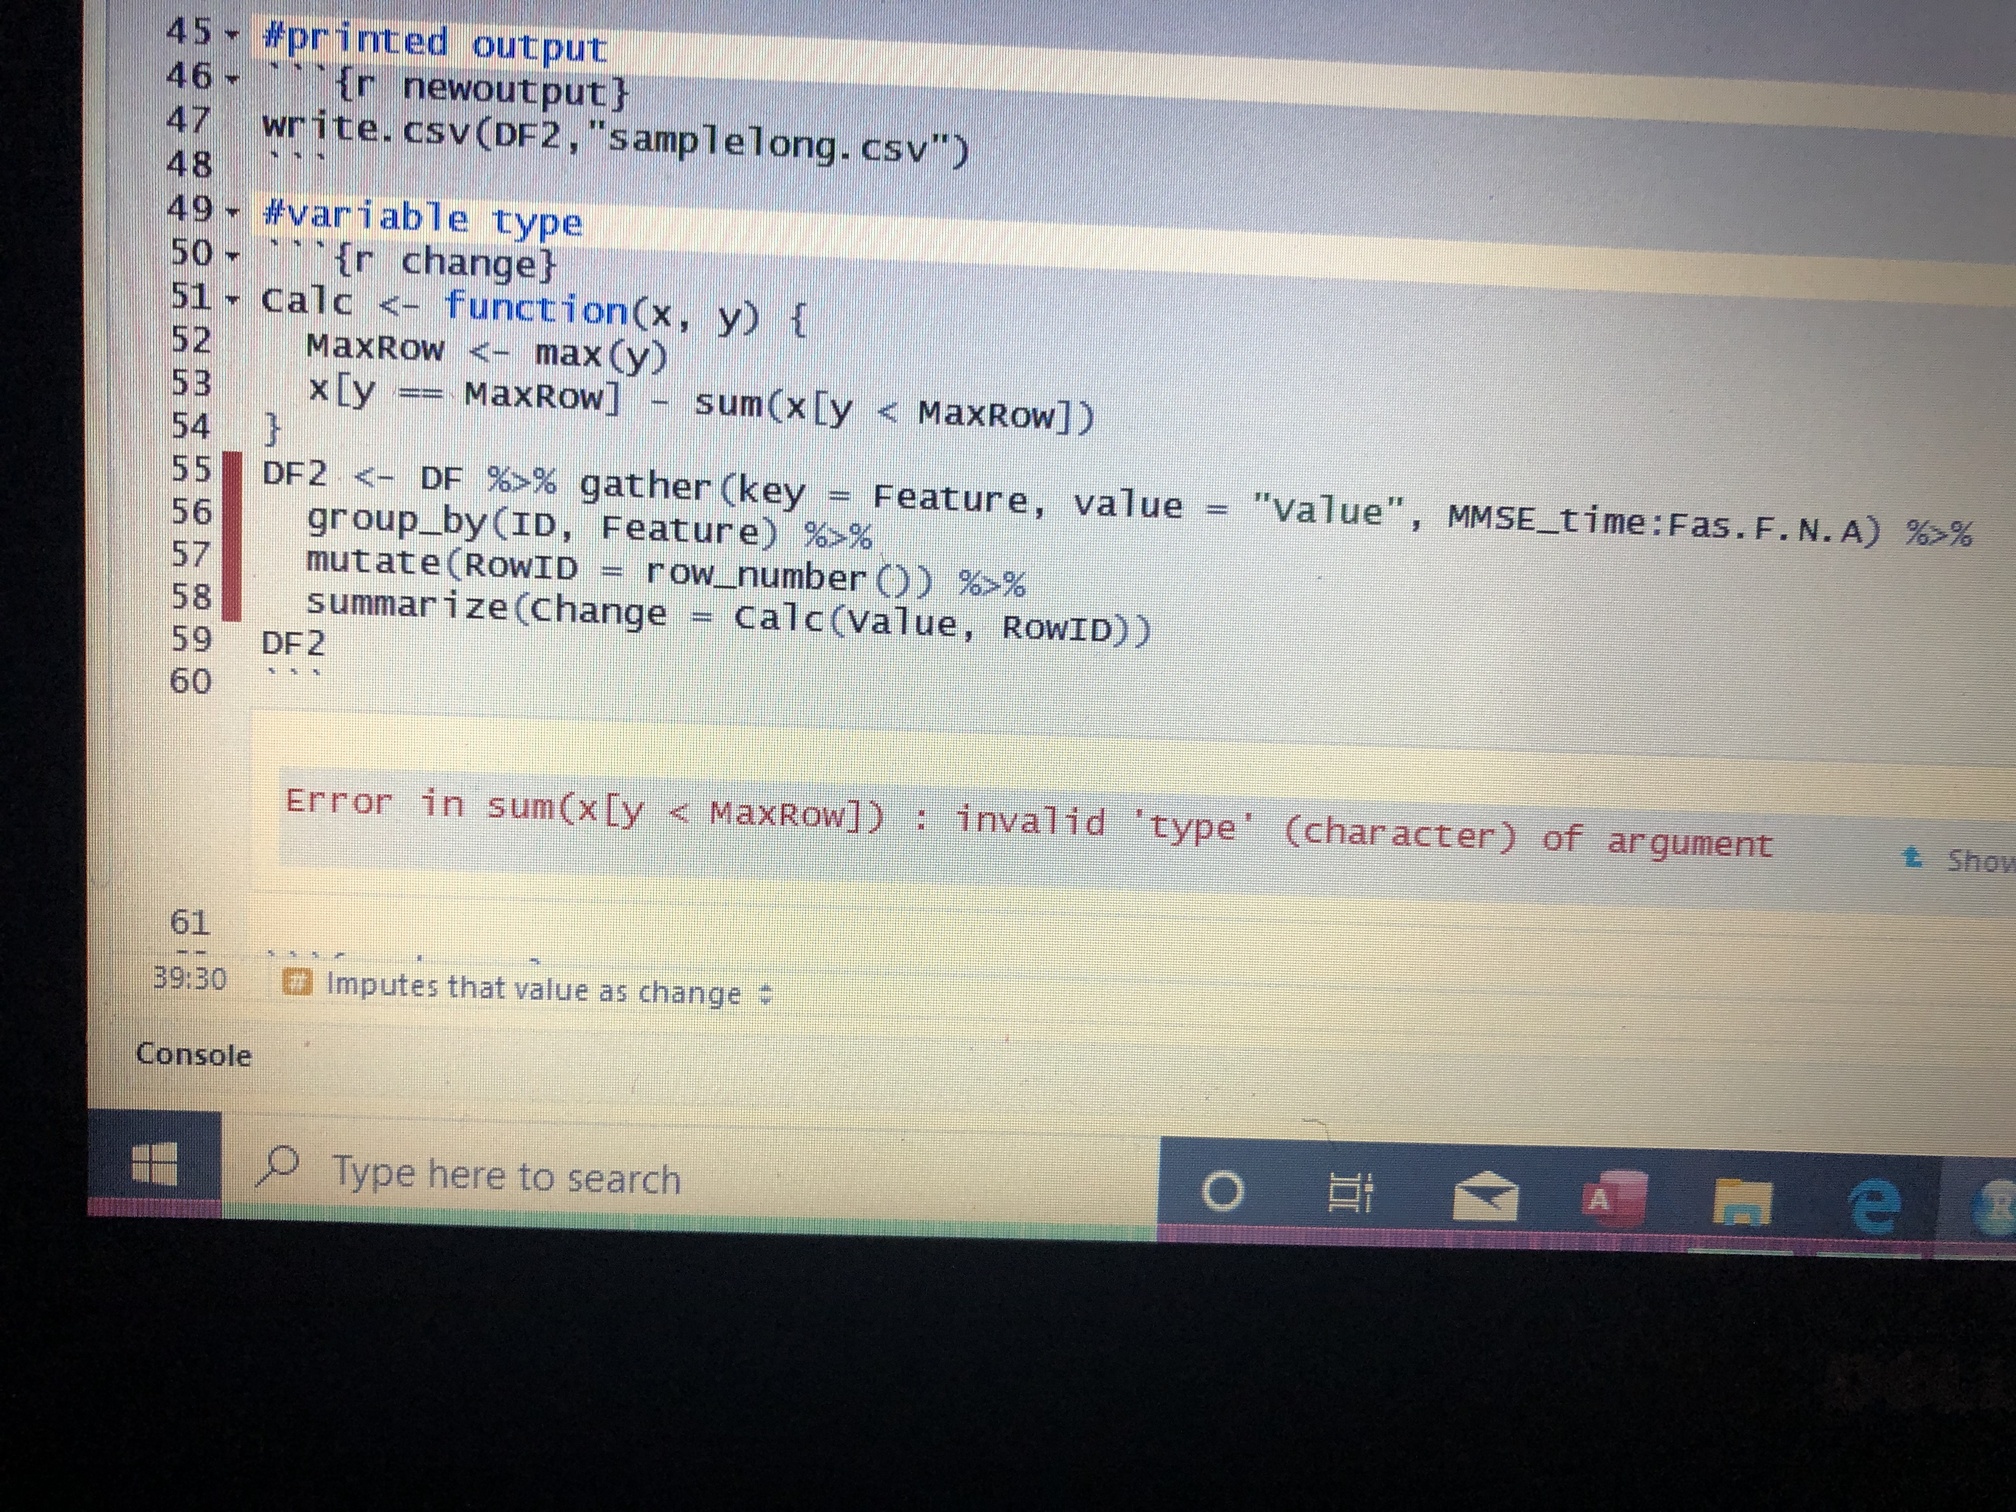
I was hoping the code below could work then I will think of how to turn it into a function, but I am getting the error below.
I am wondering if anyone can help me with a function to solve this.I have over 900 unique ID numbers(observations) and more than 30 variables.

Error: object 'L.Change' not found

L.Change[4,]==irisn$Sepal.Length[4,]-irisn$Sepal.Length[3,]-irisn$Sepal.Length[2,]-irisn$Sepal.Length[1,]

ID Sepal.Length L.Change Sepal.Width W.Change
1 5.1 NA 3.5 NA
1 4.0 NA 4.0 NA
1 4.9 NA 5.0 NA
1 5.0 NA 9.0 NA
2 6.5 NA 7.0 NA
2 7.0 NA 6.0 NA
2 3.9 NA 8.5 NA
2 7.0 NA 7.5 NA
3 4.7 NA 3.5 NA
3 7.0 NA 2.6 NA

The problem with the line of code you posted is that L.Change does not exist outside of irisn. You have to refer to it as irisn$L.Change. Also, == compares two objects for equality, it does not assign a value to the left hand side.
I do not think that is a workable approach to get your values, though maybe someone else can see a way to do it along those lines. I suggest staying away from placing summary calculations in a special column at the end of a group of rows. That is common in spreadsheets but it does not match well with the way R works. I took the liberty of removing the two "Change" columns and summarizing the data into a new data frame using typical R functions for grouping rows and summarizing results. Does the code below help you at all? I realize I do not know what you need to do next, so this could be useless to you.

library(tidyr)
library(dplyr)
DF <- read.csv("/home/fjcc/R/Play/Sepal.txt", sep = " ")
DF
#>    ID Sepal.Length Sepal.Width
#> 1   1          5.1         3.5
#> 2   1          4.0         4.0
#> 3   1          4.9         5.0
#> 4   1          5.0         9.0
#> 5   2          6.5         7.0
#> 6   2          7.0         6.0
#> 7   2          3.9         8.5
#> 8   2          7.0         7.5
#> 9   3          4.7         3.5
#> 10  3          7.0         2.6
Calc <- function(x, y) {
  MaxRow <- max(y)
  x[y == MaxRow] - sum(x[y < MaxRow])
}
DF2 <- DF %>% gather(key = Feature, value = "Value", Sepal.Length:Sepal.Width) %>%  
  group_by(ID, Feature) %>%  
  mutate(RowID = row_number()) %>%  
  summarize(Change = Calc(Value, RowID))
DF2
#> # A tibble: 6 x 3
#> # Groups:   ID [3]
#>      ID Feature       Change
#>   <int> <chr>          <dbl>
#> 1     1 Sepal.Length  -9    
#> 2     1 Sepal.Width   -3.5  
#> 3     2 Sepal.Length -10.4  
#> 4     2 Sepal.Width  -14    
#> 5     3 Sepal.Length   2.3  
#> 6     3 Sepal.Width   -0.900

Created on 2019-12-09 by the reprex package (v0.2.1)

Hi FJCC,

Thanks for your quick response to my question. I guess my calculation earlier on deviated from what I needed in the actual data. So what I intend to do in the actual data is to sum up the difference at each time points which in this case will be the sum of (4.0-5.1)+(4.9-4.0)+(5.0-4.9) = (-1.1)+(0.9)+(0.1)=-0.1

So with the last row, since I did not want to create a new row, what I do is to take the difference/ change that has occurred at that time and add it to the sum of the previous change values. If a new row will help us to do this, then that will be fine.

Because the focus of this analysis is on the sum of these changes for each ID, I would like to create a new column called the change(#just beside each variable). Or create this change value in excel before importing into R ( as I have done)

I will take only the ID and the new values(thus the sum of the change) for the analysis.

Thanks and I hope you can help me again.

image

If you only need the new values and the IDs for the analysis, I would calculate them like this. The idea is to shift the values of each ID/Feature combination by one row in a new column and calculate the sum of the differences between the original data and the shifted data. Note that the data set I used only has the first two values of ID = 3.


library(tidyr)
library(dplyr)
DF <- read.csv("/home/fjcc/R/Play/Sepal.txt", sep = " ")
DF
#>    ID Sepal.Length Sepal.Width
#> 1   1          5.1         3.5
#> 2   1          4.0         4.0
#> 3   1          4.9         5.0
#> 4   1          5.0         9.0
#> 5   2          6.5         7.0
#> 6   2          7.0         6.0
#> 7   2          3.9         8.5
#> 8   2          7.0         7.5
#> 9   3          4.7         3.5
#> 10  3          7.0         2.6

DF2 <- DF %>% gather(key = Feature, value = "Value", Sepal.Length:Sepal.Width) %>%  
  group_by(ID, Feature) %>%  
  mutate(LeadVal = lead(Value)) %>%  
  summarize(Change = sum(LeadVal - Value, na.rm = TRUE))
DF2
#> # A tibble: 6 x 3
#> # Groups:   ID [3]
#>      ID Feature       Change
#>   <int> <chr>          <dbl>
#> 1     1 Sepal.Length -0.1000
#> 2     1 Sepal.Width   5.5   
#> 3     2 Sepal.Length  0.5   
#> 4     2 Sepal.Width   0.5   
#> 5     3 Sepal.Length  2.3   
#> 6     3 Sepal.Width  -0.900
DF2 <- DF2 %>% mutate(Feature = paste(Feature, "Chg", sep = "_")) %>% 
                 spread(key = Feature, value = Change)
DF2
#> # A tibble: 3 x 3
#> # Groups:   ID [3]
#>      ID Sepal.Length_Chg Sepal.Width_Chg
#>   <int>            <dbl>           <dbl>
#> 1     1          -0.1000           5.5  
#> 2     2           0.5              0.5  
#> 3     3           2.3             -0.900

Created on 2019-12-10 by the reprex package (v0.2.1)

@FJCC Thank you so much for your help!!!

Hi FJCC,

I am trying to model a longitudinal data over time. Some of the variables are continues and others are categorical. Can you give me a guide on how to write the code.

Thanks

Please start a new thread since this is a different question. Also, I do not have experience modeling longitudinal data but I am sure other people on the forum can help you. If you prepare a Reproducible Example it will be much easier for others to help you.

1 Like

Hello FJCC,

I was using the first code you helped me with on a larger data set of about 3000 rows and more than 100 columns and I had this result. I have NA’s at each column too but I am not sure if that’s the reason I am getting this.

Thanks

To see if the NAs are the problem, add na.rm = TRUE to the sum function.

x[y == MaxRow] - sum(x[y < MaxRow], na.rm = TRUE)

However, if the value in x[y == MaxRow] is NA, I do not think that will help. Does it make sense to replace the NAs with zero in this data set?

I will use na.rm=True so that I can account for the missing values.

This code works perfectly fine but I tried editing to take the difference between the first and last rows only but it did not work.

DF2 <- DF %>% gather(key = Feature, value = "Value", Sepal.Length:Sepal.Width) %>%
group_by(ID, Feature) %>%
mutate(LeadVal = lead(Value)) %>%
summarize(Change = LeadVal - last(Value), na.rm = TRUE))
DF2

Can the lag function also be used for the difference?

DF <- read.csv("/home/fjcc/R/Play/Sepal.txt", sep = " ")
DF
#>    ID Sepal.Length Sepal.Width
#> 1   1          5.1         3.5
#> 2   1          4.0         4.0
#> 3   1          4.9         5.0
#> 4   1          5.0         9.0
#> 5   2          6.5         7.0
#> 6   2          7.0         6.0
#> 7   2          3.9         8.5
#> 8   2          7.0         7.5
#> 9   3          4.7         3.5
#> 10  3          7.0         2.6

library(dplyr)

library(tidyr)
DF2 <- DF %>% gather(key = Feature, value = "Value", Sepal.Length:Sepal.Width) %>%  
  group_by(ID, Feature) %>% 
  mutate(Row = row_number())

MaxRows <- DF2 %>% summarize(MaxRow = max(Row))

FirstRow = DF2 %>% filter(Row == 1)

LastRow <- DF2 %>% ungroup() %>% semi_join(MaxRows, by = c("ID", "Feature", "Row" = "MaxRow"))

Diffs <- inner_join(FirstRow, LastRow, by = c("ID", "Feature"), suffix = c(".First", ".Last"))
Diffs <- mutate(Diffs, Difference = Value.Last - Value.First)
Diffs
#> # A tibble: 6 x 7
#> # Groups:   ID, Feature [6]
#>      ID Feature      Value.First Row.First Value.Last Row.Last Difference
#>   <int> <chr>              <dbl>     <int>      <dbl>    <int>      <dbl>
#> 1     1 Sepal.Length         5.1         1        5          4    -0.1000
#> 2     2 Sepal.Length         6.5         1        7          4     0.5   
#> 3     3 Sepal.Length         4.7         1        7          2     2.3   
#> 4     1 Sepal.Width          3.5         1        9          4     5.5   
#> 5     2 Sepal.Width          7           1        7.5        4     0.5   
#> 6     3 Sepal.Width          3.5         1        2.6        2    -0.900

Created on 2019-12-18 by the reprex package (v0.2.1)

This topic was automatically closed 7 days after the last reply. New replies are no longer allowed.