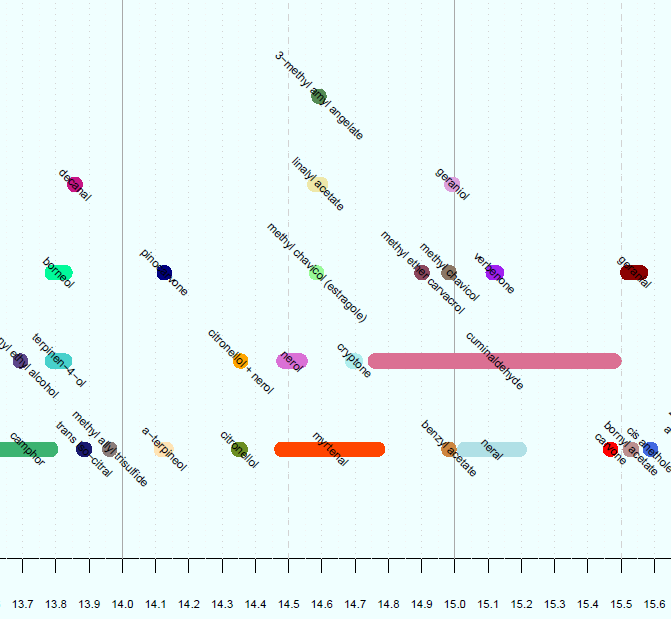
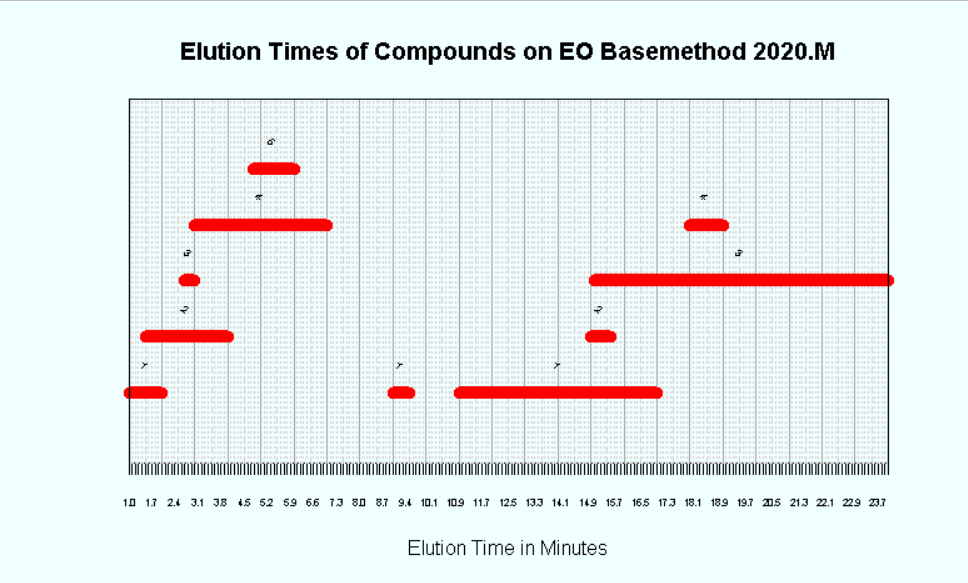
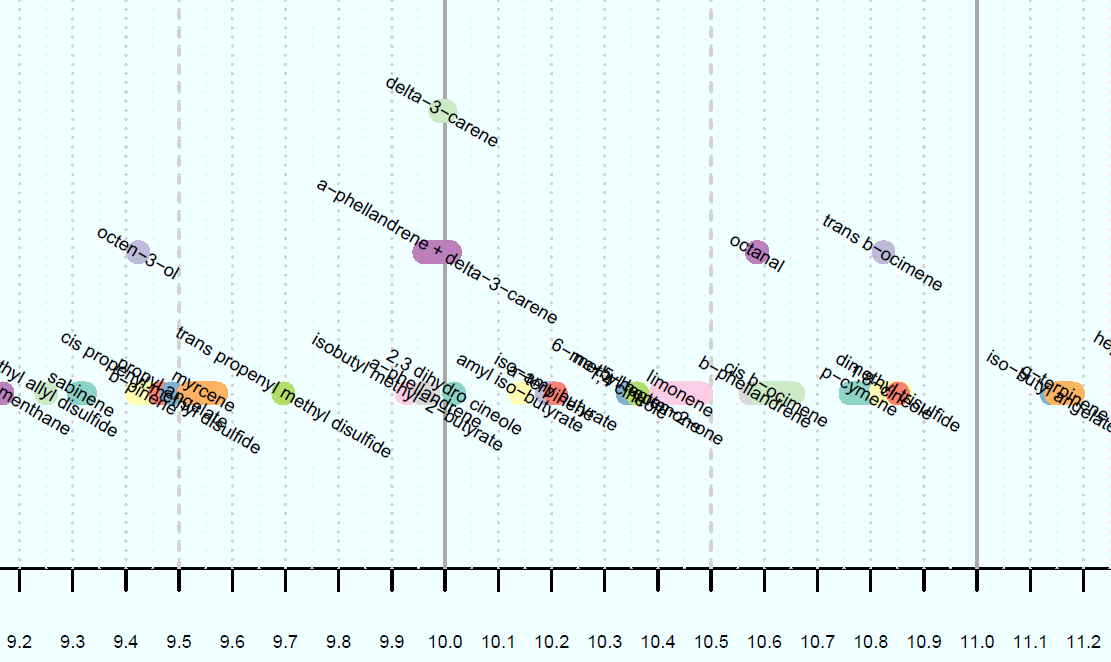
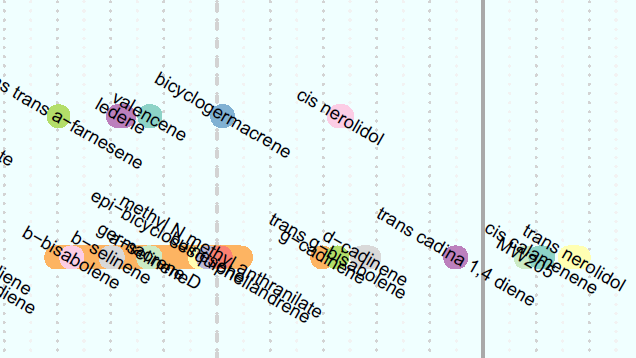
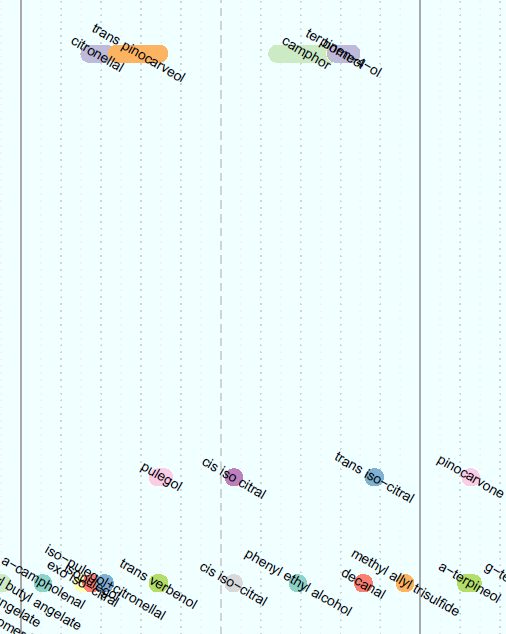
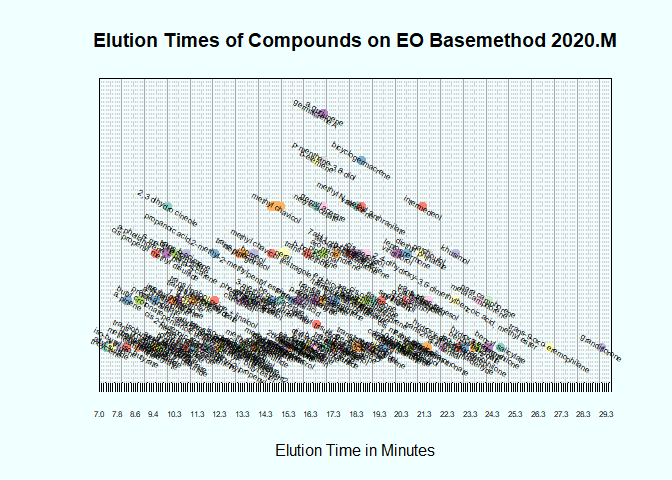
I've created the chart below, (only a small portion is pictured), but whereas here I have manually entered a value for the height of each data point, I want to be able to do it using a function. The y-value isn't meaningful, it is only for visual purposes to make sure the data points don't overlap on the chart. There are 3 x-values for each data point, being the start, end, and midpoint of the line representing the data point. These are the vectors x1, x2, and x3, respectively.
The y-values are integers between 1 and 5 inclusive, to stack the data points as shown. The code defining these vectors is:
x1 <- c(Elution_times_csv$Min elution time)
x2 <- c(Elution_times_csv$Max elution time)
x3 <- c((x1+x2)/2)
The data points are drawn on the chart using this code:
segments(x1,y,x2,y,col=colours,lwd=10)
How can I make the vector, y, of the same length as the other three vectors, which examines the x2 value of the preceding data points, compares it to the x1 value of the element being defined, and generates a value of y such that the resulting data point doesn't overlap with any preceding data point on the chart?