...
Guys!
I have the following DF:
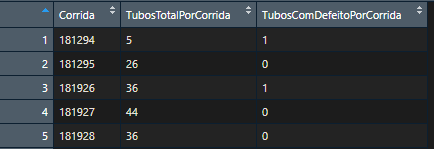
I want to build a graph using "plot_ly" where:
X axis -> Corrida
Y axis -> TubosComDefeitoPorCorrida
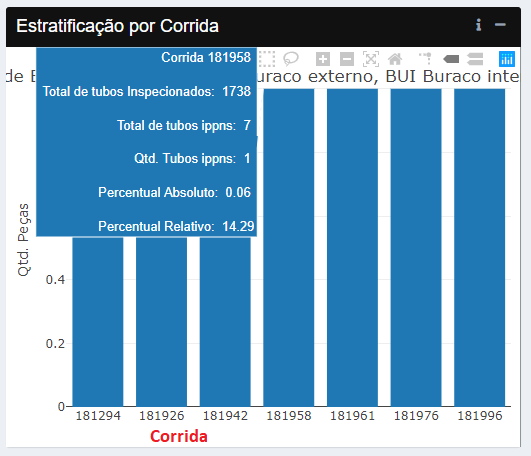
On the bars, when the user pass the mouse, must show a message like this:
           text =     '</br> \n Total de tubos Inspecionados: ', TubosTotalPorCorrida for each number of "Corrida",
                         '</br> \n Total de tubos ippns: ', TubosComDefeitoPorCorrida for each number of "Corrida",
Like the image below:
By the way, my graph code is actually:
  d <- plot_ly(data = tabela, x = ~tabela[,categoria], y = ~tabela[,eixoY],
               ##marker = list(color = "Red"),
               type = "bar",
               showlegend = F,
               hoverinfo = 'text',
               text = ~paste(switch (categoria,"corrida" = "Corrida","veio" = "Veio","sequencial" = "Barra sequencial","bloco" = "Bloco"), tabela[,categoria],
                             '</br> \n Total de tubos Inspecionados: ', lupas_inspecionadas,
                             '</br> \n Total de tubos ippns: ', tubos_indicados,
                             '</br> \n Qtd. Tubos ippns: ', tabela$ippn,
                             '</br> \n Percentual Absoluto: ', tabela$perc_absoluto,
                             '</br> \n Percentual Relativo: ', tabela$perc_relativo)) %>%
    layout(legend = list(orientation = 'h')) %>%
    layout(title = switch(categoria,"corrida"= paste0("\n Estratificação de ",paste(defeito, collapse=", ")," por Corrida"),
                          "veio"=paste0("\n Estratificação de ",paste(defeito, collapse=", ")," por Veio"),
                          "sequencial"=paste0("\n Estratificação de ",paste(defeito, collapse=", ")," por Barra Sequencial"),
                          "bloco"=paste0("\n Estratificação de ",paste(defeito, collapse=", ")," por Bloco")),
           xaxis = list(title = F,showticklabels = T),
           yaxis = list(title = switch(eixoY,"ippn" = "Qtd. Peças",
                                       "perc_absoluto" = "%",
                                       "perc_relativo" = "%")
                        ))
   return(d)