I have another data set on underground water mineral content measured along a river basin at three locations: Upper, Middle and Lower. The measured values are Hydrocarbonate, Chloride, Sulphate content and EC. I intended to upload the data but unfortunately, the Excel file formats are not accepted. I want to plot boxplots like the ones shown in the attached image in R using ggplot2. Would anyone help how I can do it? The measure variable should be o
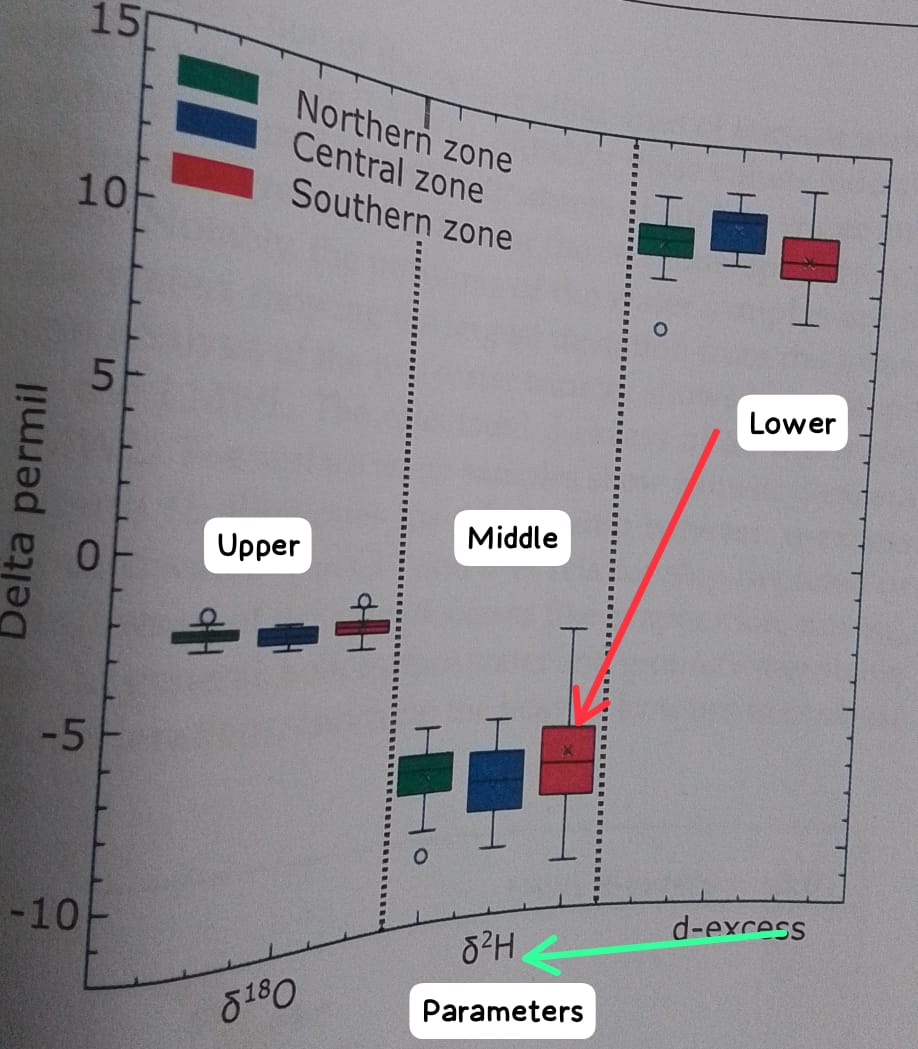
n the X-axis and the values on Y-axis as shown in the image. All boxplots have to be in one graph with one Y-axis.
Thanks in advance for your help