Boxplots with two factors

Hello,
I am trying to create boxplots showing results from an experiment with two factors (one nested in the other). The main factor is dissolved oxygen (DO) (with three levels), and the nested factor is velocity (with two levels).

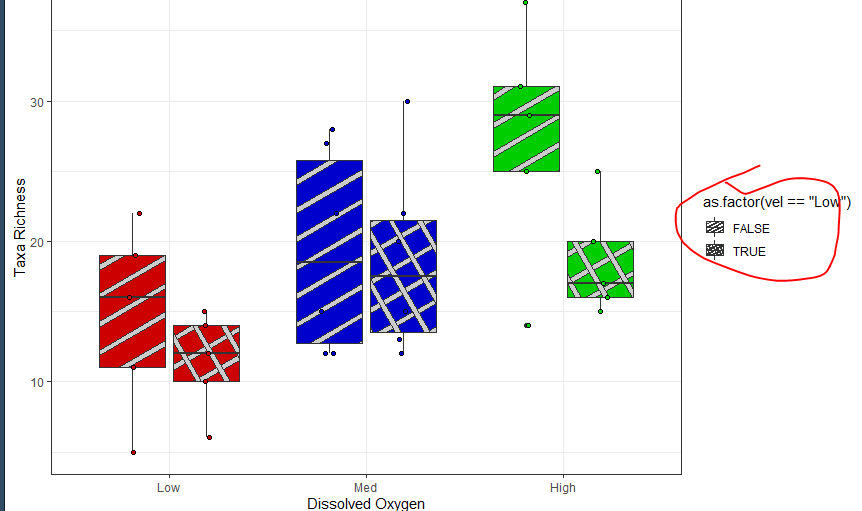
I want to make the two high DO boxes red, the two medium DO boxes blue, and the two low DO boxes green.

I want to make the low velocity boxes a different pattern than the high velocity, but having problems here.

Also:
--jittering of data not in correct boxes
-- I do not want "DO" legends (since on bottom)

thanks!
Craig

Data:

data.frame(
                            number = c(138L,254L,133L,409L,740L,359L,233L,
                                       217L,152L,629L,55L,239L,248L,462L,
                                       270L,827L,375L,219L,33L,223L,76L,
                                       352L,189L,78L,76L,24L,68L,123L,
                                       76L,72L,81L,80L),
                        number.m.2 = c(1353L,2490L,1304L,4010L,7255L,3520L,
                                       2284L,2127L,1490L,6167L,539L,2343L,
                                       2431L,4529L,2647L,8108L,3676L,
                                       2147L,324L,2186L,745L,3451L,1853L,765L,
                                       745L,235L,667L,1206L,745L,706L,
                                       794L,784L),
                              taxa = c(15L,19L,16L,37L,30L,27L,20L,25L,
                                       14L,22L,12L,16L,20L,28L,25L,31L,
                                       22L,22L,10L,11L,17L,29L,15L,12L,6L,
                                       5L,12L,15L,15L,14L,13L,12L),
                        log_number = c(2.13987908640124,2.40483371661994,
                                       2.12385164096709,2.61172330800734,
                                       2.86923171973098,2.55509444857832,
                                       2.36735592102602,2.33645973384853,2.18184358794477,
                                       2.79865064544527,1.74036268949424,
                                       2.37839790094814,2.39445168082622,
                                       2.66464197555613,2.43136376415899,2.91750550955255,
                                       2.57403126772772,2.34044411484012,
                                       1.51851393987789,2.34830486304816,
                                       1.88081359228079,2.54654266347813,
                                       2.27646180417324,1.89209460269048,1.88081359228079,
                                       1.38021124171161,1.83250891270624,
                                       2.0899051114394,1.88081359228079,
                                       1.85733249643127,1.90848501887865,1.90308998699194),
                           ln_taxa = c(2.70805020110221,2.94443897916644,
                                       2.77258872223978,3.61091791264422,
                                       3.40119738166216,3.29583686600433,
                                       2.99573227355399,3.2188758248682,2.63905732961526,
                                       3.09104245335832,2.484906649788,
                                       2.77258872223978,2.99573227355399,
                                       3.3322045101752,3.2188758248682,3.43398720448515,
                                       3.09104245335832,3.09104245335832,
                                       2.30258509299405,2.39789527279837,
                                       2.83321334405622,3.36729582998647,2.70805020110221,
                                       2.484906649788,1.79175946922805,
                                       1.6094379124341,2.484906649788,
                                       2.70805020110221,2.70805020110221,2.63905732961526,
                                       2.56494935746154,2.484906649788),
                                do = as.factor(c("Low",
                                                 "Low","High","High","Med",
                                                 "Med","High","High","Low","Low",
                                                 "Low","Low","Med","Med",
                                                 "High","High","Med","Med",
                                                 "Low","Low","High","High",
                                                 "Med","Med","Low","Low","Med",
                                                 "Med","High","High","Med",
                                                 "Med")),
                               vel = as.factor(c("Low",
                                                 "High","Low","High","Low",
                                                 "High","Low","High","Low",
                                                 "High","Low","High","Low","High",
                                                 "Low","High","Low","High",
                                                 "Low","High","Low","High",
                                                 "Low","High","Low","High",
                                                 "Low","High","Low","High",
                                                 "Low","High")),
                           raceway = as.factor(c("1","1",
                                                 "2","2","3","3","4","4",
                                                 "5","5","6","6","7","7",
                                                 "8","8","9","9","10","10",
                                                 "11","11","12","12","13",
                                                 "13","14","14","15","15",
                                                 "16","16")),
                             block = as.factor(c("1","1",
                                                 "1","1","1","1","1","1",
                                                 "2","2","2","2","2","2",
                                                 "2","2","3","3","3","3","3",
                                                 "3","3","3","4","4","4",
                                                 "4","4","4","4","4"))
                      )
#>    number number.m.2 taxa log_number  ln_taxa   do  vel raceway block
#> 1     138       1353   15   2.139879 2.708050  Low  Low       1     1
#> 2     254       2490   19   2.404834 2.944439  Low High       1     1
#> 3     133       1304   16   2.123852 2.772589 High  Low       2     1
#> 4     409       4010   37   2.611723 3.610918 High High       2     1
#> 5     740       7255   30   2.869232 3.401197  Med  Low       3     1
#> 6     359       3520   27   2.555094 3.295837  Med High       3     1
#> 7     233       2284   20   2.367356 2.995732 High  Low       4     1
#> 8     217       2127   25   2.336460 3.218876 High High       4     1
#> 9     152       1490   14   2.181844 2.639057  Low  Low       5     2
#> 10    629       6167   22   2.798651 3.091042  Low High       5     2
#> 11     55        539   12   1.740363 2.484907  Low  Low       6     2
#> 12    239       2343   16   2.378398 2.772589  Low High       6     2
#> 13    248       2431   20   2.394452 2.995732  Med  Low       7     2
#> 14    462       4529   28   2.664642 3.332205  Med High       7     2
#> 15    270       2647   25   2.431364 3.218876 High  Low       8     2
#> 16    827       8108   31   2.917506 3.433987 High High       8     2
#> 17    375       3676   22   2.574031 3.091042  Med  Low       9     3
#> 18    219       2147   22   2.340444 3.091042  Med High       9     3
#> 19     33        324   10   1.518514 2.302585  Low  Low      10     3
#> 20    223       2186   11   2.348305 2.397895  Low High      10     3
#> 21     76        745   17   1.880814 2.833213 High  Low      11     3
#> 22    352       3451   29   2.546543 3.367296 High High      11     3
#> 23    189       1853   15   2.276462 2.708050  Med  Low      12     3
#> 24     78        765   12   1.892095 2.484907  Med High      12     3
#> 25     76        745    6   1.880814 1.791759  Low  Low      13     4
#> 26     24        235    5   1.380211 1.609438  Low High      13     4
#> 27     68        667   12   1.832509 2.484907  Med  Low      14     4
#> 28    123       1206   15   2.089905 2.708050  Med High      14     4
#> 29     76        745   15   1.880814 2.708050 High  Low      15     4
#> 30     72        706   14   1.857332 2.639057 High High      15     4
#> 31     81        794   13   1.908485 2.564949  Med  Low      16     4
#> 32     80        784   12   1.903090 2.484907  Med High      16     4

Created on 2024-08-27 with reprex v2.1.0

First basic plot and second plot:

plot1.basic <- raceways %>%
  ggplot(aes(x = do, y = taxa, fill = vel, color = do)) +
  geom_boxplot(aes(fill = vel)) + 
  labs(x= "Dissolved Oxygen", y = "Taxa Richness", fill = "Velocity") +
  theme_bw()
#> Error in raceways %>% ggplot(aes(x = do, y = taxa, fill = vel, color = do)): could not find function "%>%"
plot1.basic
#> Error in eval(expr, envir, enclos): object 'plot1.basic' not found

plot1a <- raceways %>%
  ggplot(aes(x = do, y = taxa, fill = do, color = vel)) +
  geom_boxplot(aes(fill = do, color = vel),show.legend = TRUE, 
               outlier.shape = NA, alpha= 0.5, width = 0.6, coef=0) + 
  # geom_col_pattern(aes(fill = vel), color = 'black', pattern = 'crosshatch') +
  labs(x= "Dissolved Oxygen", y = "Taxa Richness", fill = "Velocity") +
  scale_fill_manual(values = c("red","blue", "green")) +
  geom_jitter(show.legend = FALSE, width = 0.25, shape = 21, color = "black") +
  theme_bw()
#> Error in raceways %>% ggplot(aes(x = do, y = taxa, fill = do, color = vel)): could not find function "%>%"
plot1a
#> Error in eval(expr, envir, enclos): object 'plot1a' not found

Created on 2024-08-27 with reprex v2.1.0

Thanks for the reprex!

If I'm not mistaken, you want the pattern to apply to the boxplot, not add a column on top of the boxplot. So you need to replace the boxplot by geom_boxplot_pattern

raceways %>%
  ggplot(aes(x = do, y = taxa, fill = do, pattern = as.factor(vel == "Low"))) +
  geom_boxplot_pattern() +
  scale_pattern_discrete(choices = c("stripe", "crosshatch")) +
  labs(x= "Dissolved Oxygen", y = "Taxa Richness", fill = "Velocity") +
  scale_fill_manual(values = c("red3","blue3", "green3")) +
  geom_jitter(position = position_jitterdodge(jitter.width = .2),
              show.legend = FALSE, shape = 21, color = "black") +
  theme_bw() +
  guides(fill = "none")

Note also the aesthetic pattern_fill if you want to change the color of the stripes rather than the box itself.

For that, you need to specify position_dodge() inside the geom. Or in this case position_jitterdodge().

To remove a single guide (a single legend) without affecting the other one, you can do guides(fill = "none") (change fill to the aesthetic to remove).

Great work on the boxplots! For the issues with patterns and jittering, make sure you have the necessary libraries installed and loaded. It looks like you're missing the dplyr package, which provides the %>% operator. Adding library(dplyr) might resolve the errors.

@AlexisW --thank you so much!

I am trying to modify (make the distances between the stripes and crosshatches using:
scale_pattern_spacing_discrete(range = c(0.01, 0.05)) +

but, could not change it. Any ideas?

Also, the legend and legend title is off. Is there a way to hack this? Thanks

@abuislam --thanks. I was using library(tidyverse) that I thought automatically loaded dplyr. But I will add it separately. Thanks again.

As far as I can tell, the problem is that in your reprex you did not include library(tidyverse) and library(ggpattern) to make it a valid reprex.

What do you mean with off? The fact that it's an ugly title? In that case you can just ensure that the legend title corresponds to a nice column name, some thing like:

raceways %>%
  mutate(`Low velocity` = as.factor(vel == "Low")) %>%
  ggplot(aes(x = do, y = taxa, fill = do, pattern = `Low velocity`)) +
  geom_boxplot_pattern() +
  ...

or you can overwrite the legend title in guides(), for example:

... +
guides(fill = "none", pattern = guide_legend(title = "Low velocity"))

If you want the values to have better values than TRUE and FALSE, you can use the mutate approach above, something like:

raceways %>%
  mutate(Velocity = if_else(vel == "Low", "Low", "Not low")) %>%
  ggplot(aes(x = do, y = taxa, fill = do, pattern = Velocity)) +
  geom_boxplot_pattern() +
  ...

Note the as.factor() in my initial code is probably not required, I used it just in case and didn't try removing it.

This is a scale, i.e. when you have a mapping between a variable and an aesthetic (inside aes()), you can use this function to specify that mapping. For example, for the fill color, you did specify aes(fill = do), then you could use a scale_fill_*() to specify which fill color to use for which value.

So in your case, the aesthetic is pattern_spacing (see ?geom_boxplot_pattern for all available aesthetics), if you use it to map to a variable, you can use scale_pattern_spacing_*() to specify how the spacing and variable are related. Here, you did not specify pattern_spacing in your aes(), so the scale_ function has no effect.

I think what you're trying to do is:

raceways %>%
  mutate(Velocity = if_else(vel == "Low", "Low", "Not low")) %>%
  ggplot(aes(x = do, y = taxa, fill = do, pattern = Velocity)) +
  geom_boxplot_pattern(pattern_spacing = .02)

to use the same spacing everywhere, or

raceways %>%
  mutate(Velocity = if_else(vel == "Low", "Low", "Not low")) %>%
  ggplot(aes(x = do, y = taxa, fill = do, pattern = Velocity, pattern_spacing = Velocity)) +
  geom_boxplot_pattern()

to map the spacing to the Velocity variable (and then use scale_pattern_spacing_*() to specify how the spacing should depend on the velocity).

My goal is to visually differentiate the boxplots by coloring them: the high DO boxes should be red, the medium DO boxes blue, and the low DO boxes green. I want to use distinct patterns to represent the different velocity levels, but I'm encountering some challenges in implementing this in my visualization.

@KillianSulli Did you have any suggestions?

Hi Killian,

If it's a different question, could you create a new topic? And please include a reproducible example so we can see what the "challenges" are.