Hello,
I don't know if I can ask this here but I have a small problem with R Studio box plot creation, maybe it's a silly question but anyways.
I'm working with different lines of plants that have different values of over expression of a gene (this really doesn't matter a lot but only giving the context) so my data set is organized the following way:
Lines OverExpression levels
1P 1233, 12232, 3268
2P. etc.
3P
etc.
The problem is that I want to create a boxplot from this data, like for exemple all the values from line 1P regrouped in a box plot.
By using the function boxplot() R Studio tells me that X values aren't numerical which is right, they are line names. My questions is the following, how can I arrange my data in order to make boxplot from each line with the different values (and of course all in 1 graph).
Thank you very much and sorry for my poor English,
Here's an example of taking "wide" format data (which it sounds like you have) and reshaping it to produce something that's easier for either base graphics boxplot() or ggplot2 to work with. (This is also an example of how you can create a reproducible example data set for other people to work with, which helps clarify your question ).
library(tidyverse)

# Create some imaginary sample data
set.seed(42) # to make this reproducible

gene_overexpr <- data.frame(
  line = c("1P", "2P", "3P"),
  sample_1 = sample.int(12000, size = 3),
  sample_2 = sample.int(12000, size = 3),
  sample_3 = sample.int(12000, size = 3),
  sample_4 = sample.int(12000, size = 3),
  sample_5 = sample.int(12000, size = 3)
)

gene_overexpr
#>   line sample_1 sample_2 sample_3 sample_4 sample_5
#> 1   1P    10978     9966     8840     8461    11217
#> 2   2P    11244     7701     1616     5493     3065
#> 3   3P     3434     6229     7883     8628     5547

# Note that `line` is a factor (default for character values when using `data.frame`)
# In this case, that makes good sense since `line` is a categorical variable
str(gene_overexpr)
#> 'data.frame':    3 obs. of  6 variables:
#>  $ line    : Factor w/ 3 levels "1P","2P","3P": 1 2 3
#>  $ sample_1: int  10978 11244 3434
#>  $ sample_2: int  9966 7701 6229
#>  $ sample_3: int  8840 1616 7883
#>  $ sample_4: int  8461 5493 8628
#>  $ sample_5: int  11217 3065 5547

# Convert to "long" format using `tidyr`
gene_overexpr_long <- gene_overexpr %>%
  gather(
    # names for new columns
    key = "sample", value = "overexpr_level",
    # gather all the columns *other than* `line`
    -line
  )

gene_overexpr_long
#>    line   sample overexpr_level
#> 1    1P sample_1          10978
#> 2    2P sample_1          11244
#> 3    3P sample_1           3434
#> 4    1P sample_2           9966
#> 5    2P sample_2           7701
#> 6    3P sample_2           6229
#> 7    1P sample_3           8840
#> 8    2P sample_3           1616
#> 9    3P sample_3           7883
#> 10   1P sample_4           8461
#> 11   2P sample_4           5493
#> 12   3P sample_4           8628
#> 13   1P sample_5          11217
#> 14   2P sample_5           3065
#> 15   3P sample_5           5547
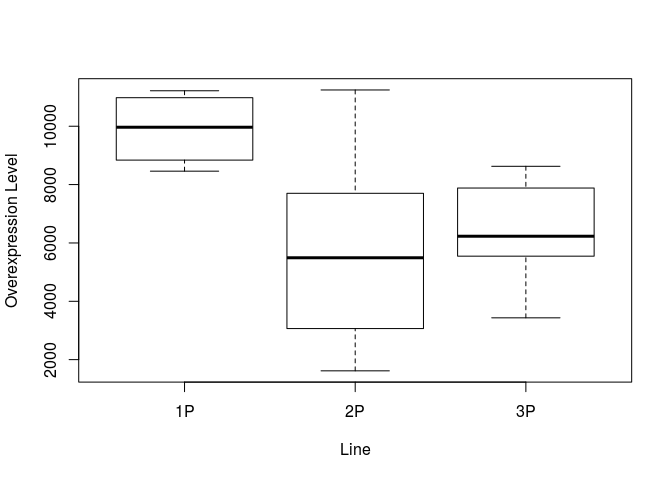
# Boxplot using base graphics. The formula should be: y ~ group
boxplot(
  overexpr_level ~ line, data = gene_overexpr_long,
  xlab = "Line", ylab = "Overexpression Level"
)
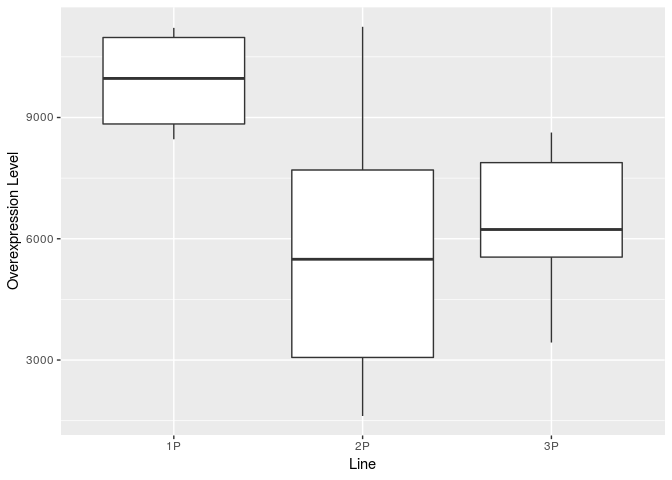
# Boxplot using `ggplot2`
ggplot(gene_overexpr_long, aes(x = line, y = overexpr_level)) +
  geom_boxplot() +
  labs(x = "Line", y = "Overexpression Level")