Hello everyone! My problem is trival I think, but I'm just starting my adventure with data visualization in R and have absolutely no idea where to find the function that I need. Could you please prompt me?
I made a boxplot merged with violinplot. Here is my code:
Blockquote
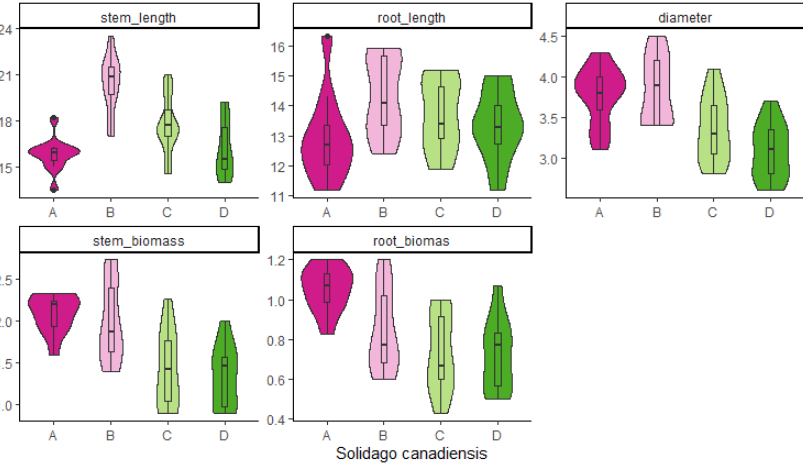
Could you please tell me, how can I remove this frames above every single plot (black frame around the variable name)? I would be very thankful!
Your specific case can be solved by setting color of strips to white:
example_plot+
  theme(strip.background = element_rect(colour = "white"))
Read this documentation for more details:
Themes are a powerful way to customize the non-data components of your plots:
i.e. titles, labels, fonts, background, gridlines, and legends. Themes can be
used to give plots a consistent customized look. Modify a single plot's theme
using theme();...
P.S. Please learn how to provide usable reprex.
Oh great, it works! Thank you very much for help!
system
April 8, 2021, 9:48am
4
This topic was automatically closed 21 days after the last reply. New replies are no longer allowed.