My code gives me flat lines instead of a boxplot no matter what i do.
'''ggplot(testbp, aes(x = Dataset, y = Values, fill = Model)) +'''
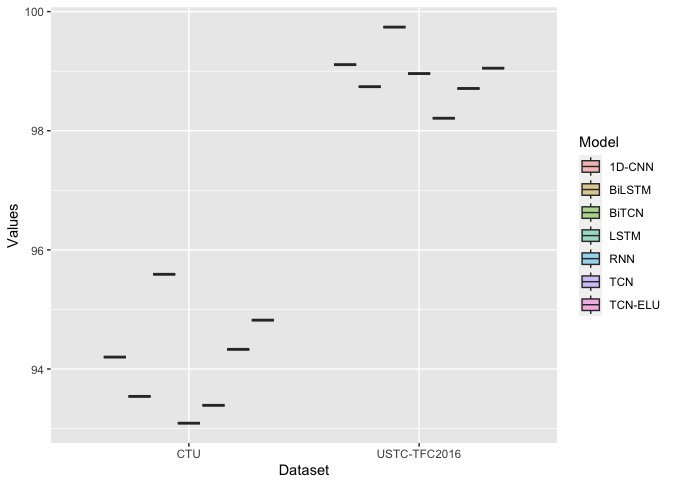
Below image is the result of my code above with the flat lines
Below is my dataset i was working on
0
Metric
Values
Model
Dataset
1
Precision
98.74
BiLSTM
USTC-TFC2016
2
Precision
99.11
1D-CNN
USTC-TFC2016
3
Precision
98.96
LSTM
USTC-TFC2016
4
Precision
98.21
RNN
USTC-TFC2016
5
Precision
98.71
TCN
USTC-TFC2016
6
Precision
99.05
TCN-ELU
USTC-TFC2016
7
Precision
99.74
BiTCN
USTC-TFC2016
8
Precision
93.54
BiLSTM
CTU
9
Precision
94.20
1D-CNN
CTU
10
Precision
93.09
LSTM
CTU
11
Precision
93.39
RNN
CTU
12
Precision
94.33
TCN
CTU
13
Precision
94.82
TCN-ELU
CTU
14
Precision
95.59
BiTCN
CTU
Thanks for providing code. Could you kindly take further steps to make it easier for other forum users to help you? Share some representative data that will enable your code to run and show the problematic behaviour.
How do I share data for a reprex?
You might use tools such as the library datapasta, or the base function dput() to share a portion of data in code form, i.e. that can be copied from forum and pasted to R session.
Reprex Guide
Thank you. I have shared my dataset as requested
the models per dataset are unique so there is no variation of values suitable for representing with a box
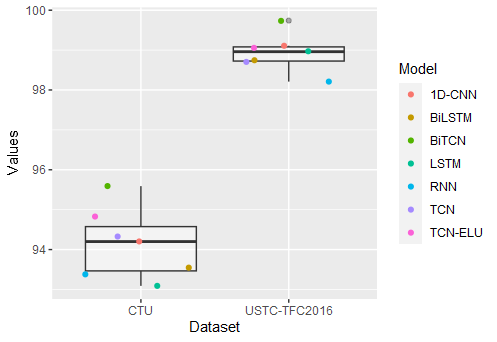
Edit:
ggplot(testbp,
aes(x = Dataset, y = Values)) +
geom_boxplot(varwidth = TRUE, alpha = 0.4)+
  geom_jitter(aes(color=Model))
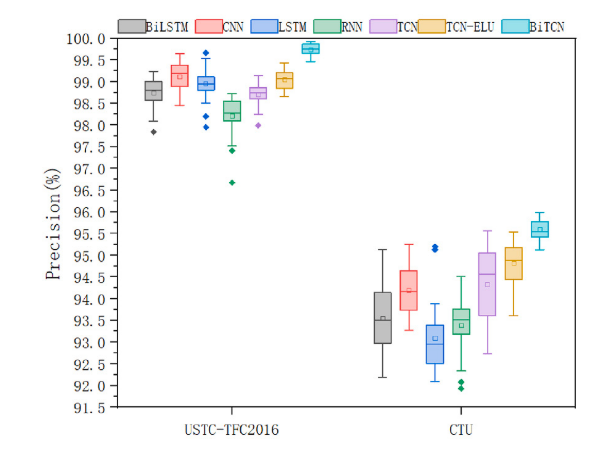
Great. However, you try to generate boxplots from the "Model" based on the dataset. Because that is what i wanted to achieve.
Something like this below:
therefore you should gather more data...
Please explain further if possible. I don't seem to understand.
So i am analyzing a precision matrics with it's values per the models that were tested on the two datasets.
I feel that perhaps i need to restructure my data but i am new to the whole boxplot so i don't seem to know how to go about it.
Please assist any way that you can.
niirex1:
||BiLSTM|USTC-TFC2016
you only have one fact about this model and dataset; that fact is '98.74'
Ok. So how many do i need to be able to generate the boxplot?
the absolute minimum, to see a box shape is two.
Many thanks for your help. I will add some more data, as indicated earlier.
system
April 11, 2023, 2:43pm
12
This topic was automatically closed 7 days after the last reply. New replies are no longer allowed.