Boxplot costomization by group

I have a boxplot with a group on the left (Baseline.RT) and a group on the right (TBPM.RT). I want to rename Baseline.RT to 1-back and TBPM.RT to TBPM. I also want each group to have a different square frame. I would also like to try black and white options to fill in the values for Neutral, Positive, and Negative.

I have tried several options but did not get the result I wanted. Below is my code. Any help is welcome.

DataFrame:

data.frame(
   stringsAsFactors = FALSE,
        Participant = c(1, 2, 3, 4, 5, 6),
                Sex = c("m", "m", "m", "f", "f", "m"),
                Age = c(29, 21, 29, 22, 25, 31),
             Stress = c(14, 26, 11, 19, 15, 15),
       Dass21.total = c(6, 43, 4, 10, 12, 8),
        Dass21Ansie = c(0, 12, 1, 3, 2, 2),
         Dass.Depre = c(1, 11, 0, 1, 3, 0),
        Dass.Stress = c(5, 20, 3, 6, 7, 6),
            Valence = c(0, 1, 2, 0, 1, 2),
        Baseline.RT = c(1.17657473346937,
                        0.656485061072056,0.617504973518475,0.552112912223171,
                        0.587283706967395,0.569011248952529),
            TBPM.RT = c(1.16126499995575,
                        0.682658424923267,0.643632301167193,0.589782671563839,
                        0.705303832011063,0.691478784144668),
   TotalClockChecks = c(44, 97, 44, 93, 32, 90),
    TotalChecks5060 = c(13, 22, 17, 23, 10, 27),
   TotalClockResets = c(18, 20, 19, 19, 18, 19),
     Correct.Resets = c(16, 16, 18, 18, 12, 19),
   Before.55.Resets = c(0, 2, 0, 1, 0, 0),
    After.65.Resets = c(2, 2, 1, 0, 6, 0),
      MeanResetTime = c(63.0026438647087,
                        58.9040712799639,60.9928466685597,60.4603108544334,
                        65.859630879724,60.5522703813385),
  Accuracy.Baseline = c(0.987179487179487,
                        0.991489361702128,0.97907949790795,0.987234042553191,1,
                        0.987234042553191),
      Accuracy.TBPM = c(0.968619246861925,
                        0.972746331236897,0.989626556016598,0.972515856236786,
                        0.974736842105263,0.991786447638604),
       rau.Baseline = c(112.453264487601,
                        114.413187265486,109.508971532343,112.475825131896,
                        122.999999959683,112.475825131896),
           rau.TBPM = c(106.447535249234,
                        107.58519024216,113.516946707831,107.519541719961,
                        108.163803190644,114.564811317506)
)

Plot:

my44 %>% 
  select(Participant, Valence, Baseline.RT,TBPM.RT) %>% #Select interest variables
  gather(Task,RT, -Valence, -Participant) %>% 
  ggplot(., aes(factor(Valence), RT)) + #plot
  geom_boxplot() + facet_wrap(~ Task) +
  scale_x_discrete(name = element_blank(), labels=c("0" = "Neutral", "1" = "Positive", "2" = "Negative")) + 
  scale_fill_discrete(name="Valence", 
                      breaks=c("0", "1", "2"),
                      labels=c("Neutral", "Positive",
                               "Negative"))

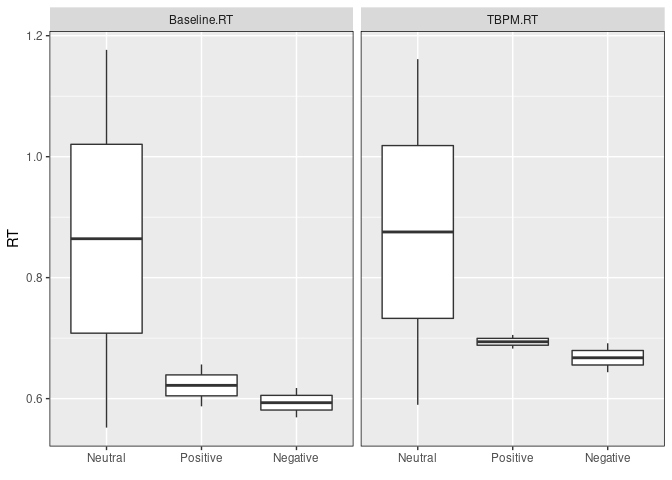
The obtained results:

Created on 2020-09-02 by the reprex package (v0.3.0)

The reprex below uses theme to add the boxes. Other arguments are available for other adjustment.

suppressPackageStartupMessages({library(dplyr)
                                library(ggplot2)
                                library(tidyr)})
my44 <- data.frame(
  stringsAsFactors = FALSE,
  Participant = c(1, 2, 3, 4, 5, 6),
  Sex = c("m", "m", "m", "f", "f", "m"),
  Age = c(29, 21, 29, 22, 25, 31),
  Stress = c(14, 26, 11, 19, 15, 15),
  Dass21.total = c(6, 43, 4, 10, 12, 8),
  Dass21Ansie = c(0, 12, 1, 3, 2, 2),
  Dass.Depre = c(1, 11, 0, 1, 3, 0),
  Dass.Stress = c(5, 20, 3, 6, 7, 6),
  Valence = c(0, 1, 2, 0, 1, 2),
  Baseline.RT = c(1.17657473346937,
                  0.656485061072056,0.617504973518475,0.552112912223171,
                  0.587283706967395,0.569011248952529),
  TBPM.RT = c(1.16126499995575,
              0.682658424923267,0.643632301167193,0.589782671563839,
              0.705303832011063,0.691478784144668),
  TotalClockChecks = c(44, 97, 44, 93, 32, 90),
  TotalChecks5060 = c(13, 22, 17, 23, 10, 27),
  TotalClockResets = c(18, 20, 19, 19, 18, 19),
  Correct.Resets = c(16, 16, 18, 18, 12, 19),
  Before.55.Resets = c(0, 2, 0, 1, 0, 0),
  After.65.Resets = c(2, 2, 1, 0, 6, 0),
  MeanResetTime = c(63.0026438647087,
                    58.9040712799639,60.9928466685597,60.4603108544334,
                    65.859630879724,60.5522703813385),
  Accuracy.Baseline = c(0.987179487179487,
                        0.991489361702128,0.97907949790795,0.987234042553191,1,
                        0.987234042553191),
  Accuracy.TBPM = c(0.968619246861925,
                    0.972746331236897,0.989626556016598,0.972515856236786,
                    0.974736842105263,0.991786447638604),
  rau.Baseline = c(112.453264487601,
                   114.413187265486,109.508971532343,112.475825131896,
                   122.999999959683,112.475825131896),
  rau.TBPM = c(106.447535249234,
               107.58519024216,113.516946707831,107.519541719961,
               108.163803190644,114.564811317506)
)

my44 %>% 
  select(Participant, Valence, Baseline.RT,TBPM.RT) %>% #Select interest variables
  gather(Task,RT, -Valence, -Participant) -> to_plot

p <- ggplot(to_plot)
p + geom_boxplot(aes(as.factor(Valence),RT)) +
    facet_grid(~ Task)  +
    scale_x_discrete(name = element_blank(), 
                     labels=c("0" = "Neutral",
                              "1" = "Positive", 
                              "2" = "Negative")) +
    scale_fill_discrete(name="Valence", 
                        breaks=c("0", "1", "2"),
                        labels=c("Neutral", "Positive",
                                 "Negative")) +
    theme(panel.border = element_rect(color = "black", 
                                      fill = NA))

Created on 2020-09-02 by the reprex package (v0.3.0)

This topic was automatically closed 7 days after the last reply. New replies are no longer allowed.

If you have a query related to it or one of the replies, start a new topic and refer back with a link.