Hi!
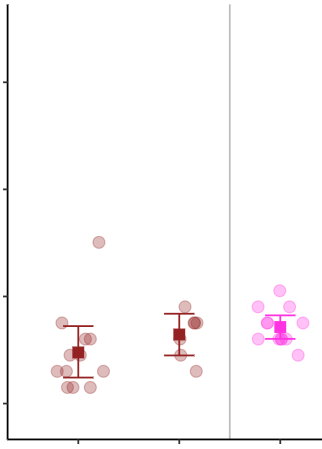
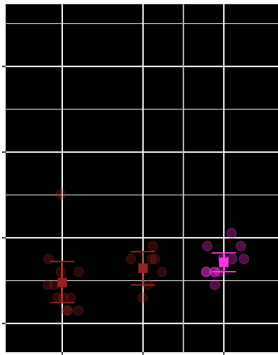
I updated my operating system and had to reinstall R, RStudio and all the packages I use. With the new version of this, when I render an html using Rmarkdown all my ggplots have a black background when I did not specify so. They look like this:
Here is the sessionInfo() of what I'm running:
sessionInfo()
R version 4.4.3 (2025-02-28 ucrt)
Platform: x86_64-w64-mingw32/x64
Running under: Windows 11 x64 (build 22631)

Matrix products: default


locale:
[1] LC_COLLATE=English_United States.utf8  LC_CTYPE=English_United States.utf8    LC_MONETARY=English_United States.utf8
[4] LC_NUMERIC=C                           LC_TIME=English_United States.utf8

time zone: Europe/Berlin
tzcode source: internal

attached base packages:
[1] stats     graphics  grDevices utils     datasets  methods   base

other attached packages:
 [1] here_1.0.1        brms_2.22.0       Rcpp_1.0.14       readr_2.1.5       tidyr_1.3.1       scales_1.4.0
 [7] forcats_1.0.0     emmeans_1.11.0    dplyr_1.1.4       stringi_1.8.4     reactable_0.4.4   htmltools_0.5.8.1
[13] patchwork_1.3.0   ggbeeswarm_0.7.2  ggplot2_3.5.2     kableExtra_1.4.0

loaded via a namespace (and not attached):
 [1] tensorA_0.36.2.1     gtable_0.3.6         beeswarm_0.4.0       xfun_0.51            htmlwidgets_1.6.4
 [6] lattice_0.22-6       tzdb_0.5.0           vctrs_0.6.5          tools_4.4.3          generics_0.1.3
[11] parallel_4.4.3       sandwich_3.1-1       tibble_3.2.1         pkgconfig_2.0.3      Matrix_1.7-2
[16] checkmate_2.3.2      RColorBrewer_1.1-3   RcppParallel_5.1.10  distributional_0.5.0 lifecycle_1.0.4
[21] compiler_4.4.3       farver_2.1.2         stringr_1.5.1        Brobdingnag_1.2-9    codetools_0.2-20
[26] vipor_0.4.7          bayesplot_1.11.1     yaml_2.3.10          pillar_1.10.2        MASS_7.3-64
[31] bridgesampling_1.1-2 abind_1.4-8          multcomp_1.4-28      nlme_3.1-167         posterior_1.6.1
[36] tidyselect_1.2.1     digest_0.6.37        mvtnorm_1.3-3        purrr_1.0.4          splines_4.4.3
[41] rprojroot_2.0.4      fastmap_1.2.0        grid_4.4.3           cli_3.6.4            magrittr_2.0.3
[46] loo_2.8.0.9000       survival_3.8-3       TH.data_1.1-3        withr_3.0.2          backports_1.5.0
[51] estimability_1.5.1   rmarkdown_2.29       matrixStats_1.5.0    zoo_1.8-14           hms_1.1.3
[56] coda_0.19-4.1        evaluate_1.0.3       knitr_1.50           viridisLite_0.4.2    rstantools_2.4.0
[61] rlang_1.1.5          xtable_1.8-4         glue_1.8.0           xml2_1.3.8           svglite_2.1.3
[66] rstudioapi_0.17.1    R6_2.6.1             systemfonts_1.2.1