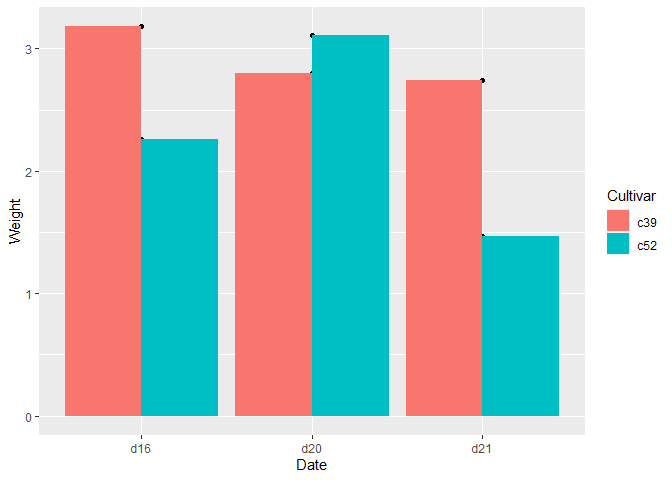
There are blackdots on top of the bars when using qplot. Any suggestions?
library(gcookbook)
library(ggplot2)
#> Warning: package 'ggplot2' was built under R version 3.6.3

qplot(Date, Weight, data = cabbage_exp, fill = Cultivar) +
  geom_bar(stat='identity', position = "dodge")
The default geom for qplot is "point" and that is producing those dots. You could set geom to "bar" within qplot, I guess, or just change the call from qplot to ggplot. I never use qplot, so my geom suggestion is a bit of a guess.