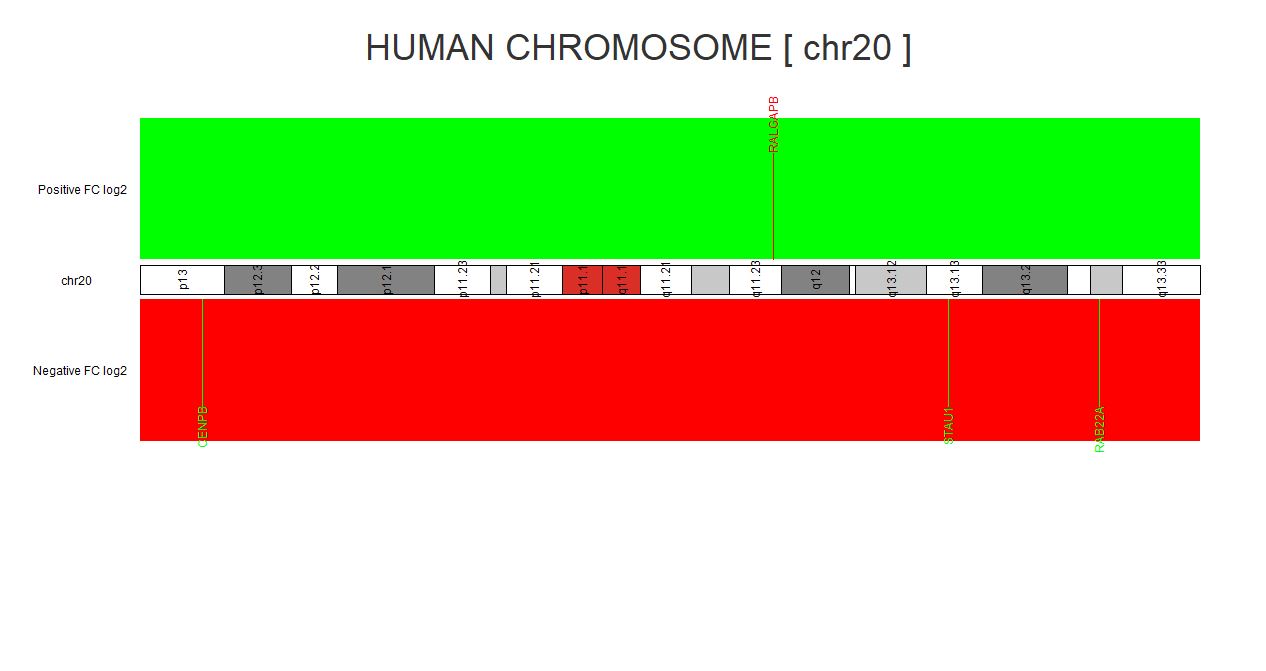
...I am making an application that plots the genes based on their p-value on the Bioconductor - karyoploteR chromosome templates.
Everything is automated but I have issues making the whole program dynamic.
currently i can read only one expression. But I am having issues in generating a logic to read multiple expressions within an excel file.
Hi Saeed, Welcome!
To help us help you, could you please prepare a repr oducible ex ample (reprex) illustrating your issue? Please have a look at this guide, to see how to create one for a shiny app
Shiny issues can be challenging to resolve relative to other problems with your code or statistical methods. Shiny apps are often large, complex projects with interacting files.
When seeking help from others it is considered polite to:
First, do your best to work through RStudio's debugging tools to diagnose your issue on your own. Often those shiny logs and tracebacks are useful to others trying to help out.
Second, strive to minimize the effort required to replicate your issue. You can do this with a reproducible example ("reprex").
Shiny Debugging
Errors in Shiny code can be difficult to track down. If you don't know where your problem is coming from, you can track it down with some o…
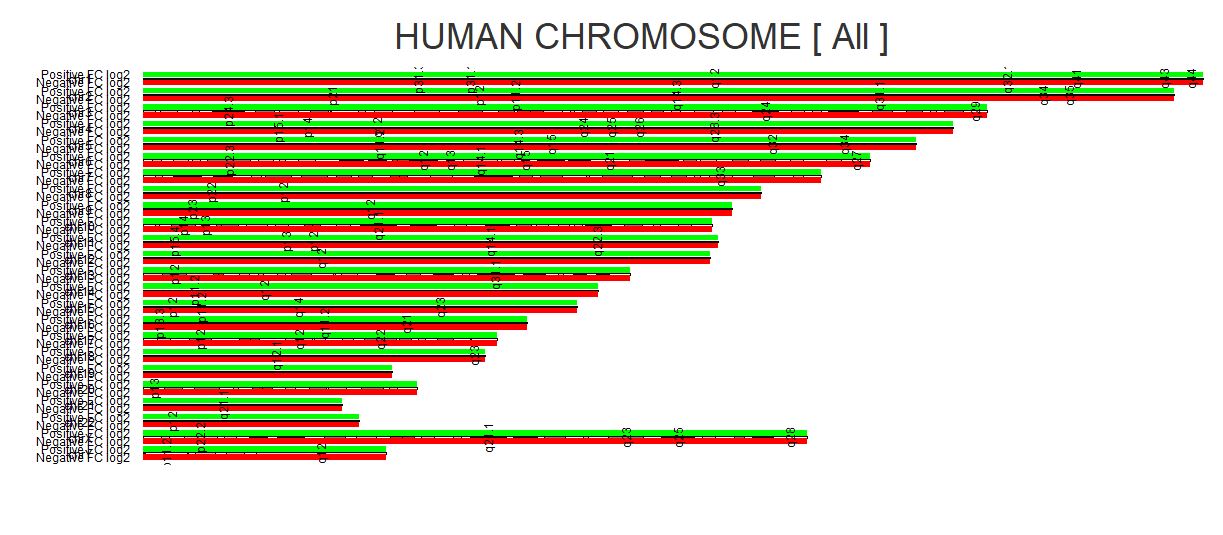
Data is being visualized clearly if I select one chromosome at a time, but when I select all the chromosomes the space is extremely jam packed, to label anything.
One thing you could do is to make the plot height dependent on the number of chromosomes
How to do that. how to change the size of the mainPanel() ?
To help us help you, could you please prepare a repr oducible ex ample (reprex) illustrating your issue?
i've solved the issue of the mainpanel() by using the fluidPage() instead of the panels